
Excel and Power BI are key for data analysts, though Excel is often where people start and stop with exploring data analysis tools. By learning to use Excel with Power BI, you can go further with your data and create sustainable solutions for you and your organization.
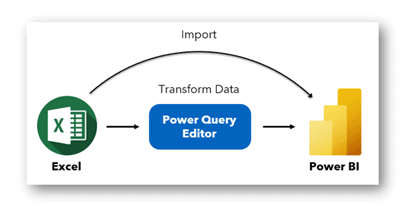
This is the first part of the Power BI x Excel blog series, where we will look at the different ways of connecting to Excel files, how to sustain future data, and automate the transformation.
We will also look at some other useful functionalities that involve Power BI and Excel and eventually touch on common data modeling transformation that one would need to analyze data that lives in Excel better.
Sections:
- Your File Location
- Let’s Import!
- Import Table or Sheet?
- To Load or to Transform?
- Import a Sheet with Multiple Tables
- Power BI Can’t Find my Excel File!
Your File Location
If you have your Excel file on your computer hard drive, the first thing to think about before importing the data is, has the file has found its forever home in the right folder and location?
If not, let’s move the file to the right folder and location before importing it in Power BI. It is important to have a permanent location and not move the file after you have imported it.
In Power BI Can’t Find my Excel File, we will look at what happens if we move the Excel file after importing it into Power BI, and how we can solve the issue.
Let’s Import!
Now that your file has a home, let’s import the data into Power BI.
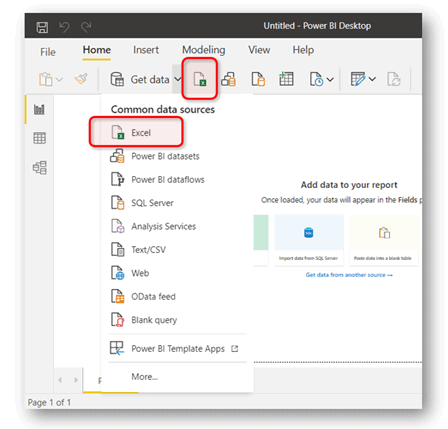
In Power BI Desktop, click Get data and select Excel in the list of common data sources, or just click the icon that has the “x” in a green box.
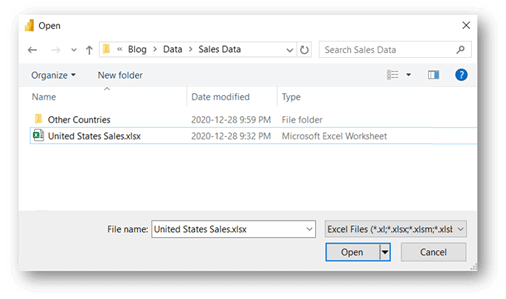
The Open window will pop up and you can navigate to your Excel file. For this demo, I will use the United States Sales file.
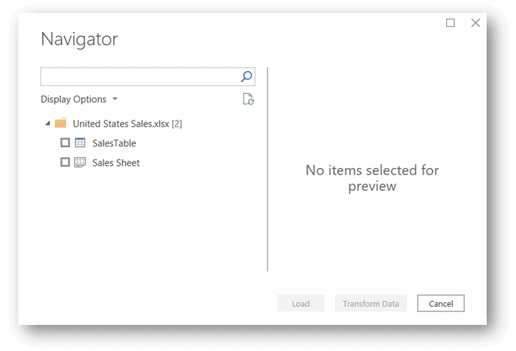
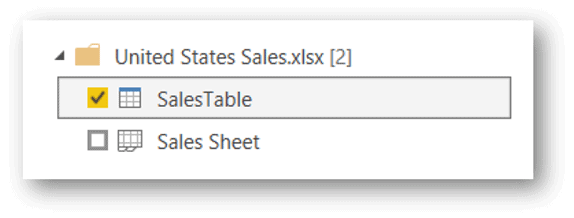
In the Navigator window, you will be able to see the file you have selected and two data import options that you can select, SalesTable and Sales Sheet. These two options may have the same preview when you click on one of them, but they are actually in a different format, as indicated by the icon next to it, Table or Sheet.
Import Table or Sheet?
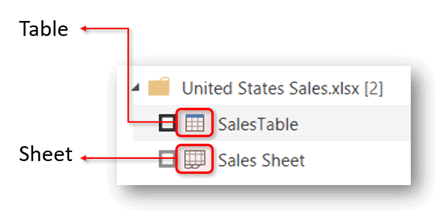
SalesTable has a table icon with a blue header, which indicates that it is a table, while Sales Sheet has the sheet icon. Let’s have a peek into Excel to see where these are and how are they different.
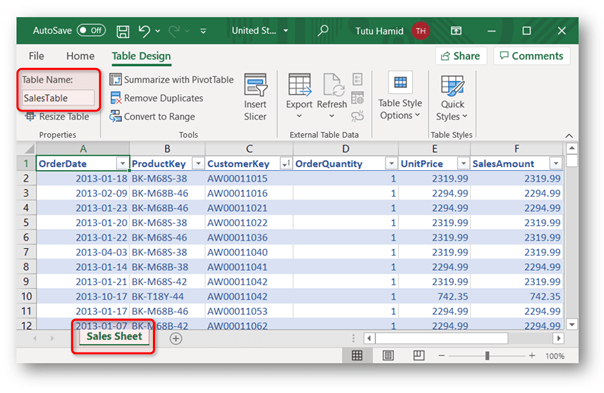
A sheet is denoted by the tab at the bottom left of the Excel window. To find out the name of a table, select any cell in the table, and click Table Design in the ribbon. The difference between a sheet and a table is that a sheet can have multiple tables. Additionally, a table can’t have spaces in the name, this explains why the name of the table we are using is SalesTable, instead of Sales Table.
Going back to our question, do we select a sheet (Sales Sheet) or a table (SalesTable) in the Navigator window? In my opinion, a table is the better option. Once you checked the table, the next question is to Load or to Transform Data?
In Import a Sheet with Multiple Tables, I will demonstrate what happens when we have a sheet that has multiple tables.
To Load or to Transform?
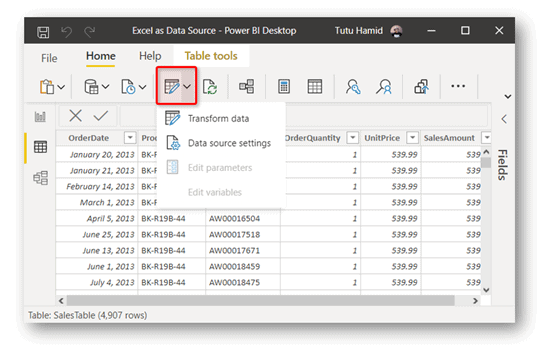
If you choose Load, Power BI desktop will connect to your Excel file and make a copy of (import) all the data in the selected table, and immediately store it in the Power BI data model of your current pbix file.
If you choose Transform Data, you will have the option to perform transformation and data cleansing in Power Query Editor before importing the data into your Power BI data model.
Either way, you will still have the option to return to Power Query Editor once you have imported the data into the Power BI data model by clicking Transform Data in Power BI Desktop.
Import a Sheet with Multiple Tables
If your sheet has only one table, importing the sheet will bring the same result as importing a table. But if your sheet has multiple tables, the imported data in Power BI will be a combination of all the tables in the sheet.
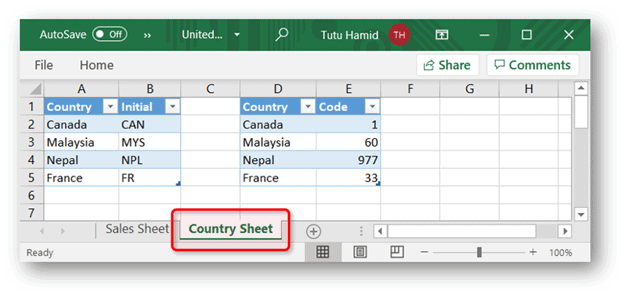
What does that mean? I am going to add another sheet named Country Sheet that has two tables (CountryCode and CountryInitial) into the Excel file and import it into Power BI.
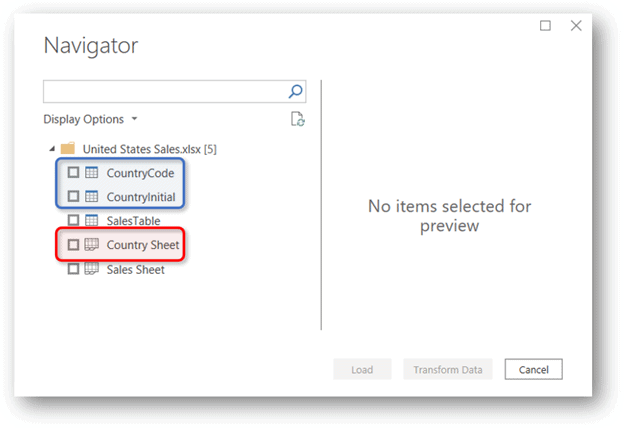
The first thing we will see is more options for sheets and tables. The sheet I just added in the Excel file is denoted by the red box in the above picture while the tables that are in the Country Sheet are also visible in the blue box (CountryCode and CountryInitial).
I will select the Country Sheet and select Load. Here is the imported result in Power BI:
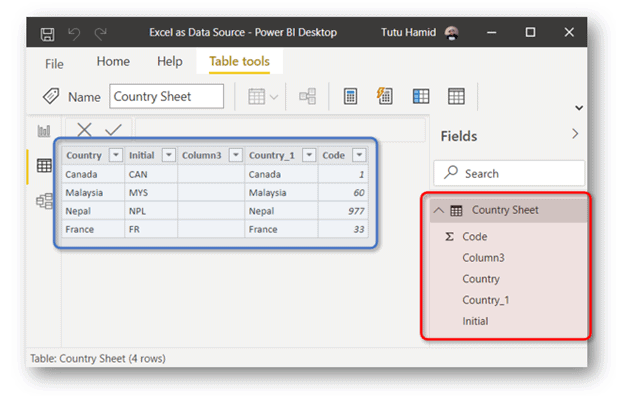
Power BI will take all data that is available in a sheet and combine the data into one single table. That is how the blank Column3 came about but this may not be the result we are looking for. Thus selecting a table instead of a sheet in the Navigator will be a more accurate way to get the right data in this example.
If you have multiple tables in a sheet, and the Navigator was not able to identify the separate tables, you may need to convert the separate tables in the original Excel file into table format by selecting the relevant cells and hitting Ctrl-T.
Power BI Can’t Find my Excel File!
If you accidentally or intentionally move your Excel file into a different folder or change the name of your Excel file, you may encounter the issue where Power BI is not able to connect to your Excel file.
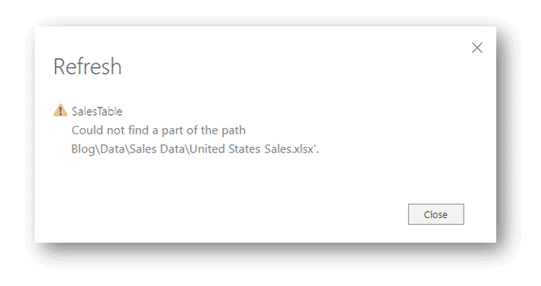
This error will usually appear if you hit refresh on your Power BI file or when you open the Power Query Editor. But don’t worry! We can fix this easily if you know the new location of the file.
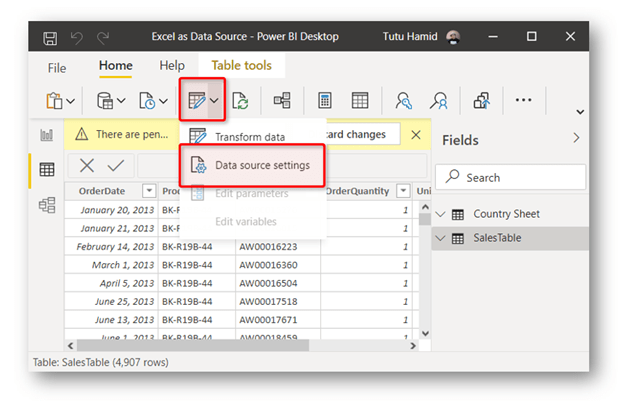
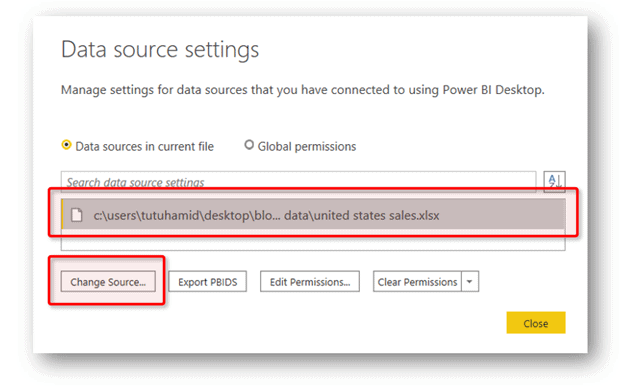
In Power BI Desktop, go to the ribbon, and select Data source settings. In the pop-up window, select the data source (i.e. the Excel file) that needs to be redirected and click Change Source.
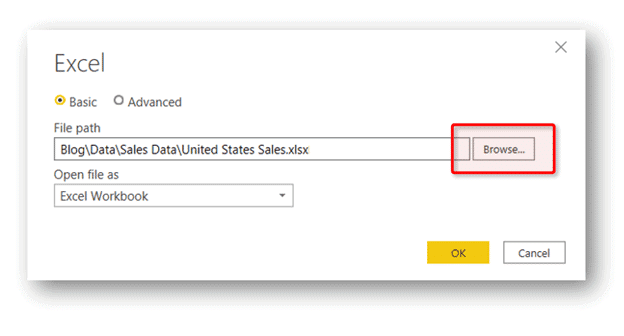
In the Excel pop-up window, click Browse and navigate to the new file location. Click OK and your file will be connected again to your Power BI report.
I hope this little tutorial will help you get started with Excel and Power BI. Stay tuned for more blogs in this Power BI x Excel series. Do you have other questions or recommendations?! Let us know in the comment section below!
