How to do Simple Linear Regression in Power BI

Section

View the tutorial in the Power BI Dashboard or keep scrolling for text!

Wait… What is Linear Regression?

Linear Regression is a statistical model applied to businesses to help forecast events based on historical trend analysis. Simple Linear regression uses one variable, called the independent variable. The independent variable predicts the outcome of another variable called the dependent variable.

A Linear Regression Model is created by fitting a trend line to a dataset where a linear relationship already exists.

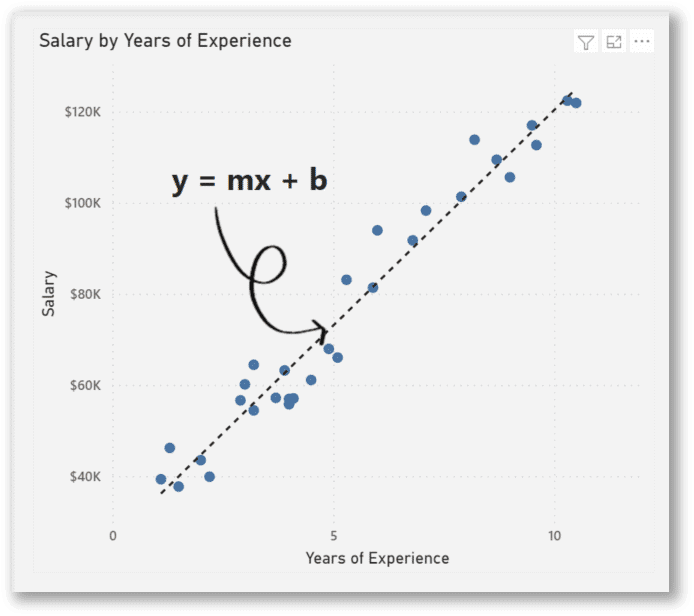
This trend line has the equation of y = mx + b and is used to make estimates.

(Note: To successfully implement Linear Regression on a dataset, you must follow the four assumptions of simple Linear Regression. Statistical tests can be performed to check the validity of the model, however, this process is beyond the scope of this tutorial.)

Tutorial

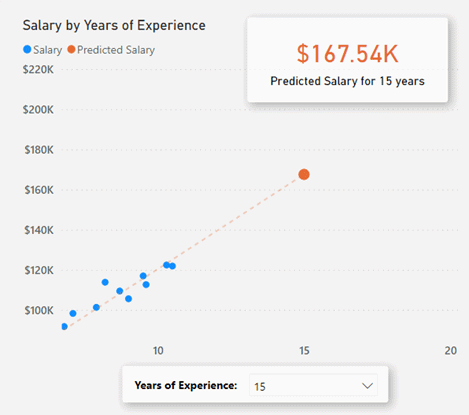
Consider this Scatterplot visual. Illustrated is the relationship between Years of Experience and Salary at a fictional company. By fitting a trend line to the Scatterplot, we can see that the more years of experience an employee has, the more they will get paid. Our y data points represent Salary in thousands, and the x data points represent Years of Experience.

Click Here to Follow the Tutorial in Power BI

According to the data above, if an employee has 15 years of experience, how much will they be paid? What about 20 years of experience? 30 years?!

Let’s try this out!

Steps we need to take:

  1. Create calculated columns and measures for the components of the equation of a line
  2. Create a What-if parameter for the x-values
  3. Create the measure of the equation of a line and insert a card visual with the measure

If you would like to follow along, this tutorial is demonstrated using the Salary_data dataset from Kaggle.com.

Step 1: Create Calculated Columns and Measures

The formula for the equation of a line is y = mx + b.

Where:

y = How far up the y axis

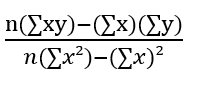
m = Slope (Change in y divided by change in x) = 

x = How far along the x axis

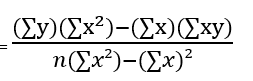
b = b-intercept (The value of y when x = 0) =

After finding out m and b with some calculations, we can input any data point for x and the output will be y.

We are going to create this formula using DAX calculated columns and measures.

These are the Calculated Columns we need to make and their DAX syntax:

Math FormulaDAX Formula
xsq =
Salary_Data[Years of Experience]^2
xyxy =
Salary_Data[Years of Experience]*Salary_Data[Salary]

These are the Measures we need to make and their DAX syntax:

Math FormulaDAX Formula
nn =
COUNTROWS(Salary_Data)
∑xy xysum =
SUM(Salary_Data[xy])
∑xxsum =
SUM(Salary_Data[Years of Experience])
∑yysum =
SUM(Salary_Data[Salary])
∑x²xsqrsum =
SUM(Salary_Data[xsq])
(n(∑xy)-(∑x)(∑y))/(n(∑x²)-(∑x)²)m (Slope) =
DIVIDE(
    [n]*[xysum]-[Xsum]*[Ysum],
    [n]*[xsqrsum]-[Xsum]^2,
    0
)
((∑y)(∑x^2)-(∑x)(∑xy))/(n(∑x²)-(∑x)²)b (Intercept) =
DIVIDE(     [ysum]*[xsqrsum]-[Xsum]*[xysum],     [n]*[xsqrsum]-[Xsum]^2,
    0
)

Step 2: Setting up a What-if parameter

Now that we have performed our calculations, for any number we insert into x, the formula will predict y.

To demonstrate this, we will be using a What-if parameter with a slicer. 

A What-if parameter allows you to create an interactive slicer with a variable to visualize and quantify another value in your report.

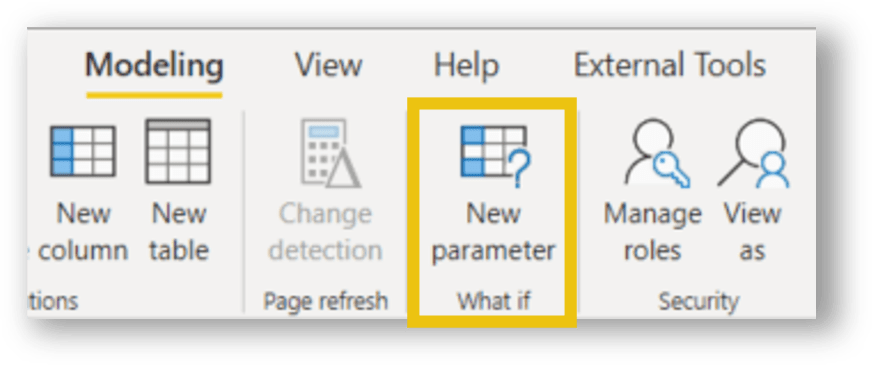
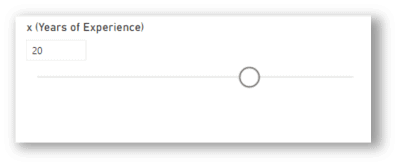
After clicking the What-if parameter on the modeling ribbon, we can input these values:

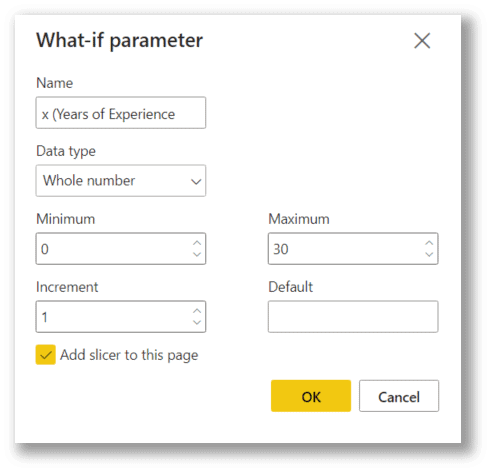
Name: x (Years of Experience)
Data type: Whole Number
Minimum: 0
Maximum: 30
Increment: 1
Add slicer to this page: Yes

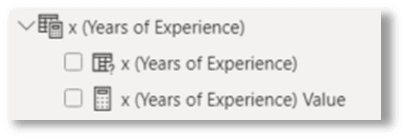
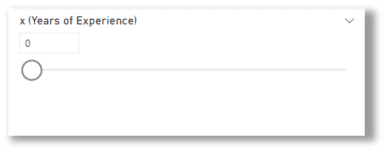
Once we press ‘OK’, the What-if parameter will have generated a series of x values and a slicer to use for our What-if scenarios.

Step 3: Complete the measure for the equation of a line and visualize

Finally, we create the Predicted Salary measure that contains the complete formula for the regression equation of a line y = mx + b, using the components we have created previously.

Math FormulaDAX Formula
y = mx + bPredicted Salary =
([m (Slope)]*
‘x (Years of Experience)'[x (Years of Experience)Value]+
[b (Intercept)]
)

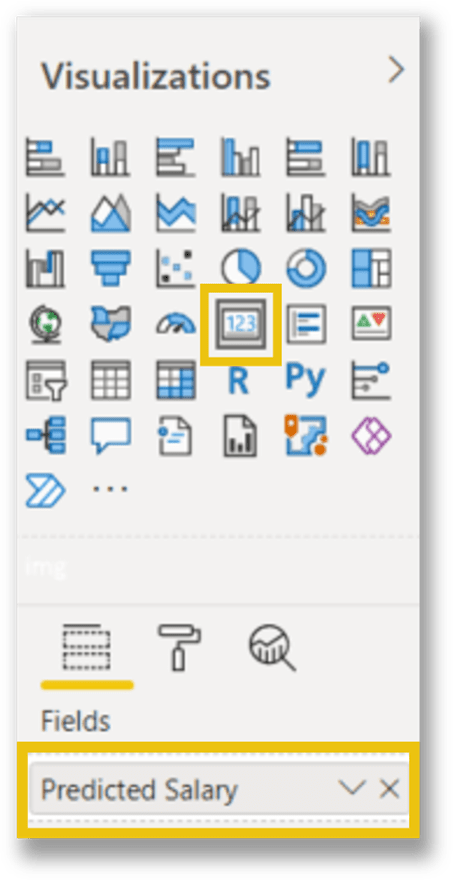
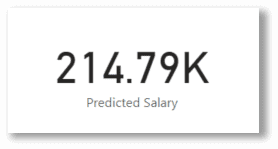
We can now insert a card visual in the report and select the measure Predicted Salary for the field.

We can test the calculation by toggling the slicer left and right. This action will interact with the Card visual and represent the predicted salary for the selected Years of Experience.

Create awesome visualizations!

There are many ways to visualize the prediction that we have set up using Linear Regression. A toggle and a card provide enough information, but we can also integrate that calculation into a chart to visualize the existing data and the predicted value.

Now you now have the power to make predictions!

Conclusion 

Linear Regression helps forecast future events by fitting a trend line to the model and using the equation of a line to predict our values. By following the steps in this tutorial, you can implement Linear Regression on a valid dataset and make estimations on future values. Try this tutorial out with a public dataset and share your findings!

Resources

If you would like to learn more statistical functions in DAX, check out Stephen Zielke’s blog post!

This tutorial was in reference to this YouTube video: DAX Fridays! #135: Linear Regression in Power BI.

The dataset used for this tutorial is called Salary_Data found a Kaggle.com.

The formulas used for Linear regression were referenced from Linear Regression: Simple Steps, Video. Find Equation, Coefficient, Slope – Statistics How To.

Stay Up to Date with Our Latest Blogs

Subscribe to our mailing list to be notified when a new article is released.

27 Comments

  • Very helpful article! Would you be able to point to any resources that could help accomplish something similar with multiple independent variables?

    Reply
  • Hi – this is an amazing demo – thanks for sharing this.
    I really liked your final visual – but I can’t work out how you linked the trend line to end at the slicer value. Could you share how you achieved this please?

    Reply
    • Hello Dan, 
      I followed up with Diana and this was her response:

      I’m happy you enjoyed the article!
      For the last visual in the Result page, there was a table and two DAX measures created for the values. The table was a table of years that looked like this: 

      Year Table

      This table was used for the axis of the visual. The first DAX measure uses a variable and says return the predicted salary formula for the selected value. The second DAX measure is the predicted salary formula, modified (using TREATAS) to use our newly created table instead of the original Years of experience column. 

      I hope this helps!

      Reply
    • Hello Dan!
      Hello Jan-Paul! Check out the steps I put in the Dashboard on how to make the visual in the Results page!
      Hope this helps!

      Reply
  • Simply awesome Diana ! This is the best explanation I have ever come across on this topic.. Thank you so much. Keep sharing

    Reply
  • This is awesome and thank you very much for your post. However I am still confused with the last visual (is it scatter chart?). Could you please write down the 2 measures and take the screenshot of the visualization configuration?.

    Thank you very much!

    Reply
    • Thank you Quan!
      I will be posting an updated version of this blog dashboard with an info page showing how the visual in the ‘Result’ tab was made.
      Stay Tuned!

      Reply
    • Hello Quan! Check out the steps I put in the Dashboard on how to make the visual in the Results page! Dax calculations included!
      Hope this helps!

      Reply
    • Hello Jan-Paul!
      My apologies to you and everyone that it is taking so long for me to post that page!
      I will get on it soon!
      Thank you!

      Reply
      • Any idea when this will be published? I’d love to understand how that visual works. Many thanks!

        Reply
        • I am so sorry to you Rebecca and everyone who has been waiting!
          I have been crazy busy at work, but I am hoping to have it published by the weekend, if not next week!
          Thank you for everyone’s patience 🙂

          Reply
          • Thanks for your response Diana, much appreciated. This is a hugely helpful article and demonstration, thanks for your efforts.

          • Hello Rebecca! Check out the steps I put in the Dashboard on how to make the visual in the Results page!
            Hope this helps!

    • Hello Jan-Paul! Check out the steps I put in the Dashboard on how to make the visual in the Results page! Dax calculations included!
      Hope this helps!

      Reply
  • Nice post. I waas checking constanly this bkog and I am impressed!
    Extremely useful inf particularly the last part 🙂 I care for such informaion a
    lot. I was seeking this certain info forr a lpng time.
    Thank you and best off luck.

    Reply
  • Super helpful!
    However, how do I sum an X-axis that are dates? I have date codes if it helps!

    Reply
    • Hello Thais,
      Just to get a little more clarity on your question, are you trying to predict the date instead of the number of years?
      Thanks for reading!

      Reply
  • Great article! However, I’m still trying to figure out the steps for the last visual. Could you please point in the right direction on how to accomplish this? (Chart type, measures/data model, screenshots etc.). Thanks!

    Reply
    • Hello Hassan, if you click through the Power BI dashboard at the beginning of the article, on the ‘Result’ page there is button to click called ‘How I made this visual’ which will give you step by step guide on how to accomplish this.
      Thanks so much for Reading!

      Reply
  • Hi. Really love the article and explanations. Thank you.
    Have implemented and seem to have done it right.
    Finding a significant challenge with the last chart. Id really like to see the final PBIX so I can pull it apart to understand how you presented that data as a Scatter Chart because I can’t get anything to work. Is there any chance you can find a way to share it?

    Reply
  • Thank you for this nice tutorial ! How have you done to publish this power bi report (Public Web) and hide the power bi report link ? Is it with a specific power bi subscription ?

    Reply

Leave a Reply to Diana Arciniega Cancel reply

Your email address will not be published.

Diana Arciniega is an Analytics Consultant for Iteration Insight. She has a Bachelor’s of Science from the University of Calgary, majoring in Actuarial Science and Minoring in Statistics and a certificate in Business Intelligence and Data Analytics from SAIT. She is very passionate about Storytelling with data and empowering others throughout their data-driven journey. In her spare time, she loves reading fantasy and science fiction and playing board games with friends.

Iterate With Us

Signup for the Iteration Insights newsletter for access to recent news and other updates.

Related Posts

Preparing Your Company for AI

Artificial Intelligence (AI) is big news, bringing the promise and peril of transformational change. Companies

Share on

Next Event

Let's get started with a consultation

get started with training

Sign up for our newsletter