
Sections
- Why do we want to remove rows from our reports?
- Exercise One: Preparing a Report
- Exercise Two: Understanding the Remove Alternate Rows Function
- Wrapping Up
Why do we want to remove rows from our reports?
Power BI is a useful tool that can do some automated processing on reports when we import them. However, this process isn’t typically sufficient, and there will often be cases where we will have to make manual adjustments to a report after it has been exported from the source.
This can happen when reports are exported from the data source in formats that are more difficult to interpret, such as a text file, or when they include elements that aren’t part of the data set, like page numbers or report dates. It can also occur when the original data contains an incorrect entry.
One of the easiest ways to correct these issues is simply to remove the rows that contain them. We can do that in Power Query Editor using a function called Remove Rows. (If you are unfamiliar with Power Query Editor, it may be beneficial to take a moment to learn a bit about it, but it’s not necessary to complete the tutorial we will be covering here.)
The Remove Rows function can be used to complete these six different types of row removals:
Remove Blank Rows: removes every blank row within a query
Remove Top Rows: removes a specified number of rows from the top of a report
Remove Bottom Rows: removes a specified number of rows from the bottom of a report
Remove Errors: removes rows that contain errors within a specified column or column(s)
Remove Duplicates: removes rows that contain identical values within a specified column or column(s)
Remove Alternate Rows: removes and keeps rows within a query using a specified pattern.
Exercise One: Preparing a Report
In this exercise we will be using five of the row removal types listed above to clean a data set. The report we are using is a sample salary report that has been exported from a source as a text file. To use the navigation paths included in this blog, create a folder called Remove Rows directly in your C: Drive. Then save the downloaded files there. You can save them where ever works for you, you will just have to use the navigation path to that location rather than the ones included in the blog.
Download the following files to complete exercise one and two:
Let’s Look at the Report
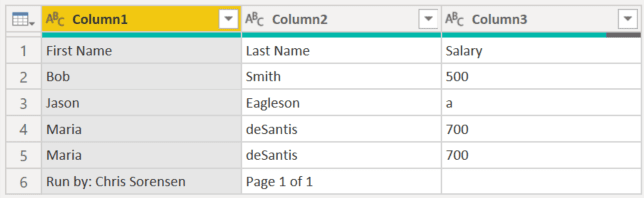
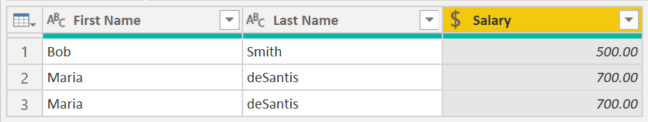
The image below shows the base file that we use for this exercise.
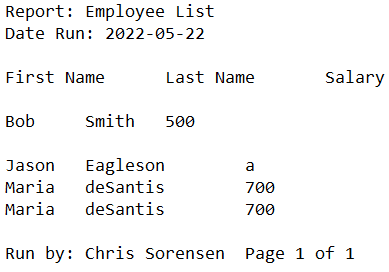
As you can see there are several issues with the report:
- The top two rows and the bottom row contain values that are not a part of the data set
- There are blank rows
- There is a duplicate row within the data set
- There is an incorrect value in the salary column
If you were to import this report into Power BI in this state, these issues would interfere with your ability to use the data set to create reports.
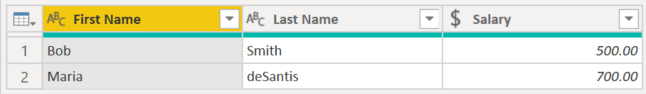
At the end of this exercise, we will have cleaned the report and will have a report that looks like the one shown below.

Import the File into Power Query Editor
- Open Power BI.
- Click the drop-down arrow on the Get Data button, located on the Home tab.
- Choose Text/CSV from the drop-down menu. The open dialog box will appear.
- Navigate to C: Remove Rows
- Select Comprehensive.
- Click Open. A dialog box with the file name in the title bar will appear.
This dialog box, often called the data preview, provides a preview of the data set as it will appear in Power Query Editor. Power Query Editor will try to determine the best options for a given data source. In this case, Power Query Editor correctly determined that the individual units of data within a row are delimited, or separated, by tabs.
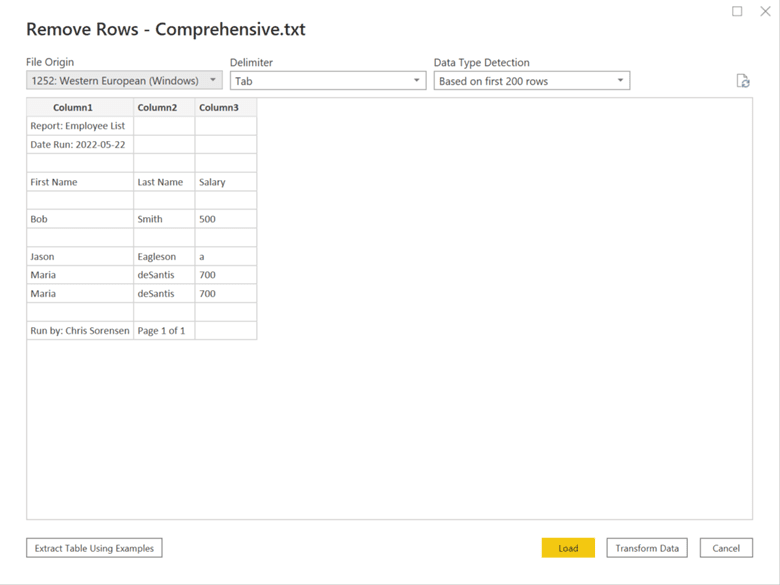
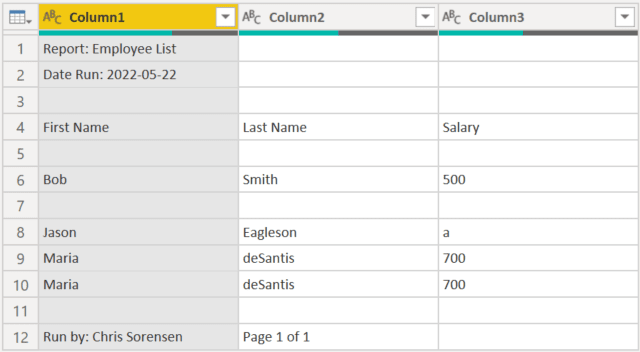
Ensure that the dialog box on your screen is formatted as shown above and click Transform Data. Power Query Editor will now launch with the query imported. You should see the query as shown below.
Remove the Blank Rows
We will use the Remove Blank Rows function to get rid of all the blank rows in the query.
- Click the Remove Rows button located on the Home tab.
- Choose Remove Blank Rows from the drop-down menu.
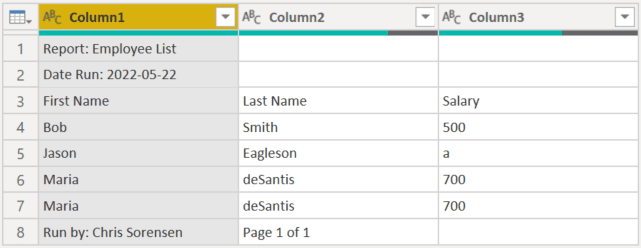
Power Query Editor will now remove all blank rows from the query.
Remove the First Two Rows
We will use the Remove Top Rows function to remove the first two rows of the query, which contain information that is not part of the data set. In the previous step Power Query Editor was able to automatically identify and remove the blank rows from the data set. In this step, we will have to tell Power Query Editor how many rows we want it to remove.
- Click the Remove Rows button located on the Home tab
- Choose Remove Top Rows from the dropdown menu. The Remove Top Rows dialog box will appear on the screen.
- Enter “2” into the Number of rows text field and click OK.
Power Query Editor will now remove the top two rows of the query.
Remove the Last Row
We will repeat this process, using the Remove Bottom Rows function to remove the row at the bottom of the query.
- Click the Remove Rows button located on the Home tab.
- Choose Remove Bottom Rows from the dropdown menu. The Remove Bottom Rows dialog box will appear on the screen.
- Enter “1” into the Number of rows text field and click OK.
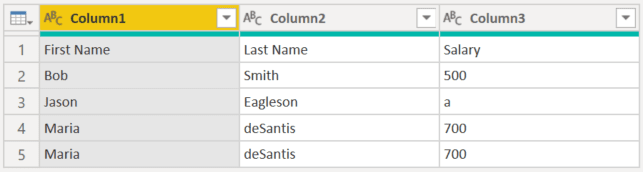
Power Query Editor will now remove the bottom row of the query.
Find and Remove Data Entry Errors
We are going to use the Remove Errors function to remove the row that contains an incorrect value in the Salary column. Before we can do that, we need Power Query Editor to identify the error within the table. Though the incorrect value is visible in this example, this would not necessarily be the case on a larger data set.
Promote the First Row to Headers
When Power Query Editor connects to a source it will typically use the first row of the data set as column headers. However, in cases where the values in the first row are not formatted using the same conventions as the values that are in the data set, Power Query Editor will not automatically assign column Headers.
We need to properly set the column Headers in order to set the data type in the next step. If we do not, Power Query Editor will incorrectly flag the Salary column header as an Error when we change the data type of the Salary Column from Text to Fixed Decimal Number.
- Navigate to the Transform tab
- Click the Use First Row as Headers button
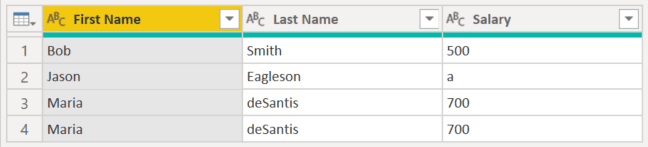
Power Query will now promote the values in the first row to the column header row.
Change the Data Type of the Salary Column from Text to Fixed Decimal Number
Assigning a data type to a column tells Power Query Editor how we want the program to assess and interpret the values. Power Query Editor has assigned the Text data type, which is the default data type, to all of the columns in the table. However, the Salary column should not contain text, it should only contain monetary values.
We will change the data type of the Salary column so that Power Query Editor understands what kind of data is supposed to be in the column and can determine if there is an error within the data.
- Click the Data Type symbol located on the left side of the Salary Column header.
- Choose the Fixed Decimal Number from the drop-down menu
- If the Change Column dialog box appears, click Replace Current
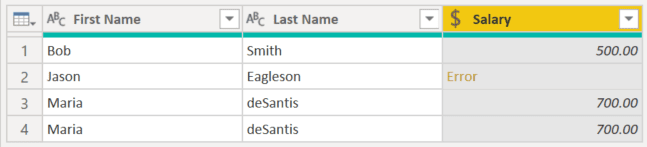
The data in the column will now be reformatted to represent the chosen data type. You will notice that an error appears in the second row of the column.
Remove the Row that Contains an Error in the Salary Column
Now that we have identified that there is a data entry error, we can use the Remove Errors function to remove the row that contains the error.
To do this properly we will need to indicate to Power Query Editor which column within the query we would like it to evaluate for errors. In this case, we want to use the Salary column.
- Select the Salary Column by clicking on the Column header.
- Click the Remove Rows button located on the Home tab.
- Choose Remove Errors from the drop-down menu.
Power Query Editor will now remove all rows that contain errors in the Salary column.
Note: When working with a real data set, you may want to create a record of the errors before you remove the rows from the query. This will allow someone with access to the data set to correct the error at the source. To do this simply duplicate the query and use the Replace Errors function and Number Filters to isolate the errors.
Remove the Duplicated Rows
Now that we have removed the errors from the data set, we will want to remove the duplicated entry from the query. Like in the last step, we could choose a column for Power Query Editor to evaluate to identify duplicated rows. We could then choose Remove Duplicates using the Remove Rows function.
However, the nature of the data contained in any given column is not unique. In a larger data set, it is possible that two individuals could have the same first name, last name, or salary. Removing the duplicates from any single column could result in the accidental loss of data. We need to indicate to Power Query Editor that we want it to remove rows that have identical values across multiple specified columns.
- Press and hold the Shift key while clicking the First Name, Last Name, and Salary column headers to select all the columns simultaneously.
- Click the Remove Rows button located on the Home tab.
- Choose Remove Duplicates from the drop-down menu.
While these two options appear to operate in the same way the M-code written by applying them is different. This means that although the result of removing duplicates from a single row or across multiple rows appears the same, Power Query Editor is processing the data differently.
M-code written when removing duplicates using only the First Name column:
= Table.Distinct(#"Removed Errors", {"First Name"})
M-code written when removing duplicates using all columns in the query:
= Table.Distinct(#"Removed Errors")
If you want more information on M-code check out Introduction To Power Query M Code.
Having used five of the six Remove Rows functions we were able to cleanse the data in the salary table provided for this example. The result should look like this:
Exercise Two: Understanding Remove Alternate Rows
The Remove Alternating Rows function does not simply remove every second row from the query. It is actually the most complicated of the row removals. This is because it allows us to dictate a pattern for Power Query Editor to use to determine which rows should be removed from a query and which should be kept in the query.
To demonstrate how to use this function we will use the second file included in the download folder for this blog. Since we already have Power Query Editor open, we will import the query directly from there.
- Click the drop-down arrow on the New Source button, located on the Home tab.Choose Text/CSV from the drop-down menu. The open dialog box will appear.
- Navigate to C: Remove Rows
- Select Alternate Rows.
- Click Open. A dialog box with the file name in the title bar will appear.
- Click OK.
The query should be imported as shown below.
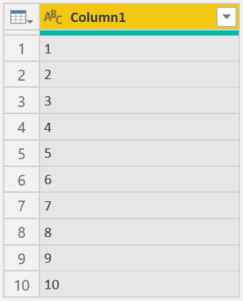
This query includes only a single column with row values from 1 to 10. This will help us to visualize the pattern Power Query Editor is using to remove rows. In order to establish the pattern that Power Query Editor will use to remove rows from the Query we need to provide it with the following values:
- The row number of the first row in the query we want to remove
- The number of rows to remove each time rows are removed
- the number of rows to keep between each removal
Use the Remove Alternating Rows Function to Remove One of Every Two Rows
We will use the Remove Rows function to provide these variables.
- Click the Remove Rows button located on the Home tab.
- Choose Remove Alternate Rows from the drop-down menu. The Remove Alternate Rows dialog box will appear.
- Input the following values in the dialog box.
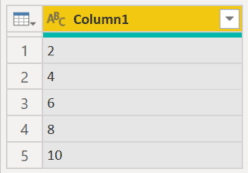
- First row to remove: 1
- Number of rows to remove: 1
- Number of rows to keep: 1
- Click OK.
Every second row will now have been removed from the query starting with 1. This will leave only even numbers within the query.
Use the Remove Alternating Rows Function to Remove Two of Every Three Rows
Entering different variables into this query will produce different results. Let’s edit the step we just did to look at a different pattern.
- Locate the PROPERTIES pane on the right side of the Power Query Editor window.
- Double-click Removed Alternate Rows from the Applied Steps list. The Remove Alternate Rows dialog box will reappear with the fields formatted as they were at the end of the previous step.
- Change the Number of rows to remove the field from 1 to 2.
- Click OK. We have now edited the step previously applied to the query.
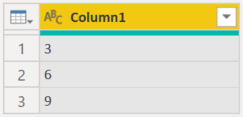
The first two of every three rows have now been removed from the query starting with 1. This leaves every third number within the table, and in fact, all the values in the table are multiples of three.
Use the Remove Alternating Rows Function to Remove Two of Every Four Rows
Now let’s change the number of rows we want to keep. Repeat the previous steps, editing the applied step using the following variables:
- First row to remove: 1
- Number of rows to remove: 2
- Number of rows to keep: 2
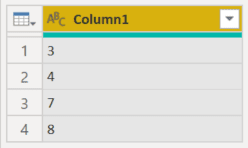
The first two of every four rows will be removed from the query. You will notice that the numbers left are sequential pairs. This is because, between each instance where we removed rows within the query, we kept two rows.
Wrapping Up
Properly removing rows is one of the easiest ways that you can use Power Query Editor to properly prepare the data sets that you need to create meaningful reports using Power BI. Because of the way that Power Query Editor functions, applying the same steps to a query each time the data is refreshed, work like this will not just ensure that your reports are useable right now, but that they will remain useable as your data set grows overtime.
