
Sections
- Why do we want to remove columns from our reports?
- Exercise One: Removing the Columns You Don’t Need
- Exercise Two: Keeping the Columns You Need
- Bonus Exercise: Using the Choose Columns Function
- Wrapping Up
Why do we want to remove columns from our queries?
When building data models, we tend to bring as much data as possible from the data source to the model in Power BI. This leads to oversized models. The more you bring data into Power BI, the more you slow down your reports. Larger datasets load and refresh slower.
It is typically best to determine which data is needed and to bring that data into the model one column at a time, rather than including everything you might ever need. This may seem to have a negligible effect if you are dealing with a smaller dataset. However, datasets typically grow over time. Reducing the data included as much as possible from the beginning of the model building process increases the longevity of our model and will result in reports that require less maintenance over time.
Smaller models also promote self-service. We want to encourage users to interact with the data and create the reports they need in Power BI. To facilitate this, not only do we want to ensure that these users are easily able to find the pertinent data, but we also might need to protect sensitive data. We can do this by removing that data using Power Query Editor.
(If you are unfamiliar with Power Query Editor, it may be beneficial to take a moment to learn a bit about it, but it’s not necessary to complete the tutorial we will be covering here.)
The report we are using is a sample employee data file. To use the navigation paths included in this blog, create a folder called Remove Columns directly in your C: Drive. Then save the downloaded files there. You can save the files wherever works for you; you will just have to use the navigation path to that location rather than the ones included in the blog.
You can download the files we will use in the exercises here:
Let’s Look at the File
The image below shows a portion of the base file that we use for this exercise:
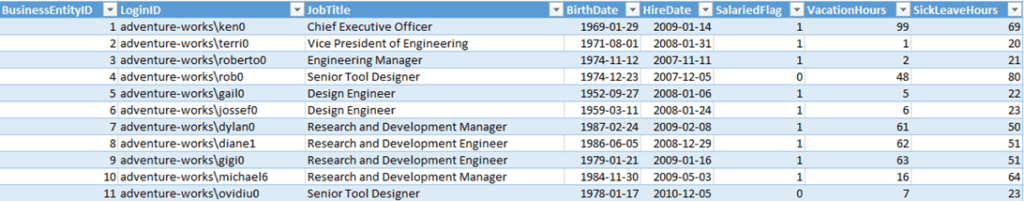
This file includes the following employee information:
- Business Entity ID
- Login ID
- Job Title
- Birth Date
- Hire Date
- Salaried Flag
- Vacation Hours
- Sick Leave Hours
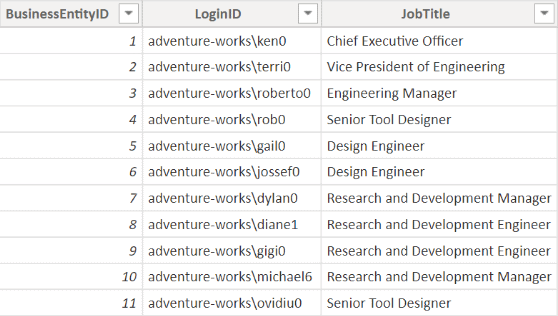
For the model that we are building, we only want to include:
- Business Entry ID
- Login ID
- Job Title
We need to remove the other columns. At the end of this exercise, we will have a table that looks like this:
Exercise One: Removing the Columns You Don’t Need
Step One: Import the File into Power Query Editor
We will open the file we downloaded in Power Query Editor:
- Open Power BI.
- Click the drop-down arrow on the Get Data button located on the Home tab.
- Choose Excel workbook from the drop-down menu. The open dialog box will appear.
- Navigate to C: Blogs > Remove Columns
- Select Remove Columns Sample Data
- Click Open. A dialog box with the file name in the title bar will appear.
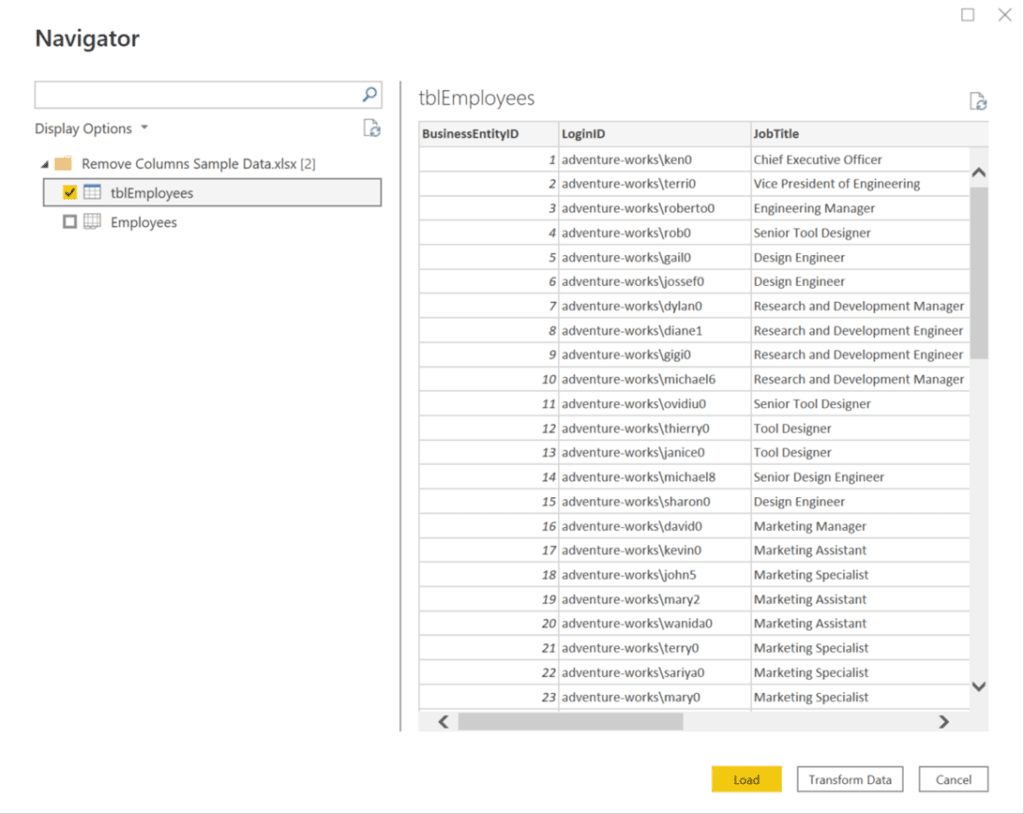
This dialog box, often called the data preview, provides a preview of the dataset as it will appear in Power Query Editor. We use this Window to tell Power Query Editor how to import the data source. Ensure that the dialog box on your screen is formatted as shown below. Then click Transform Data.
Step Two: Remove the Columns
We will select the columns that we do not want and remove them from the table using the Remove Columns function:
- Click the Header of the BirthDate Column to highlight that column.
- Hold the CTRL key and click the headers of the following additional columns to highlight them all simultaneously:
- HireDate
- SalariedFlag
- VacationHours
- SickLeaveHours
- Locate the Remove Columns button on the Home Tab
- Click the drop-down arrow
- Choose Remove Columns from the drop-down menu.
Power BI will remove the unwanted columns from the dataset. Now we will load the data into Power BI:
- Click the Close and Apply button located on the Home tab.
- Power Query Editor will close, and a dialog box will appear in Power BI as the data is loaded.
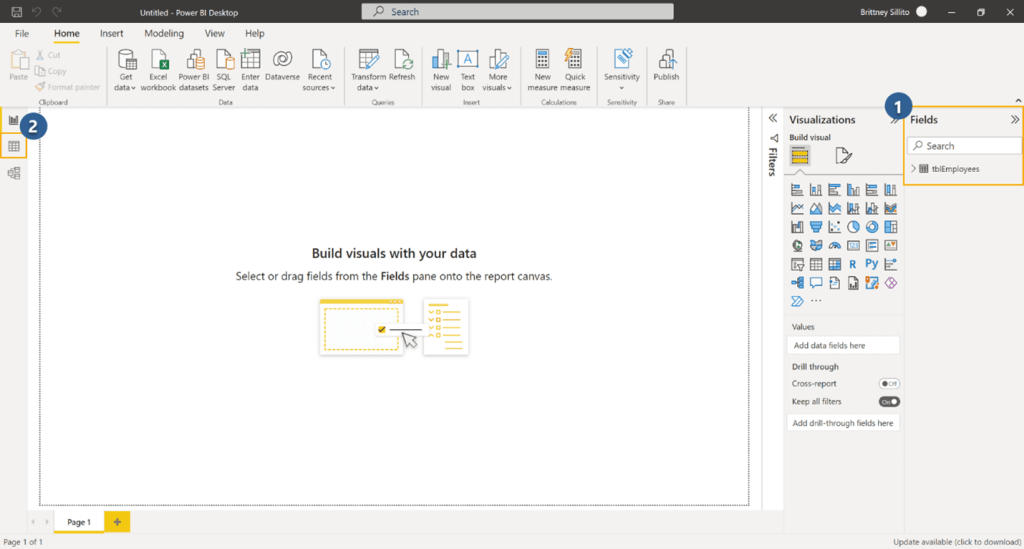
Once the data has loaded, the tblEmployees table will appear on the Fields pane located on the right side of the Power BI window:
- You can click the drop-down arrow beside the table name to expand the list of columns included in that table.
- You can view the table by selecting the Data view from the menu located on the left side of the screen.
Step Three: Simulating a New File Download
While removing the columns you don’t need may seem like the simplest solution, doing so can cause an issue if someone uploads a file that includes a new column.
We will simulate that process:
- Open the file navigator
- Navigate to C: > Remove Columns
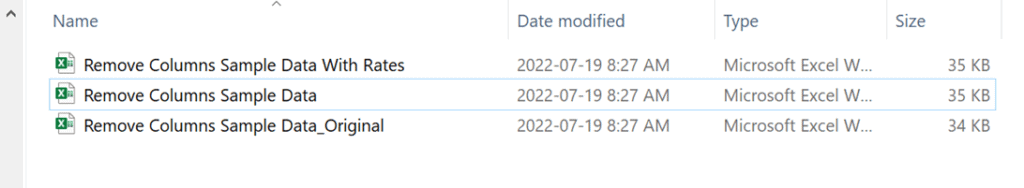
- Rename the “Remove Columns Sample Data” file to “Remove Columns Sample Data_Original”
- Create a copy of the “Remove Columns Sample Data With Rates” file
- Rename the “Remove Columns Sample Data With Rates – Copy” to “Remove Columns Sample Data”
- Once you are done the folder should look like this:
Now we will refresh the data in Power BI:
- Click the Refresh Button Located on the Home Tab
- Click the Data View button
- You can see that a RatePerHour column appears on the tblEmployees table. We do not want this information to appear in the data model, not only because we do not need it but because salary rates are considered private information.
Exercise Two: Keeping the Columns You Need
Instead of removing the columns that we want to keep, we will use the Remove Columns function to identify and keep only the columns that we need:
Step One:
We will need to undo the application of the Remove Columns function:
- Click the Transform Data button located on the Home Tab in Power BI. Power Query Editor will open.
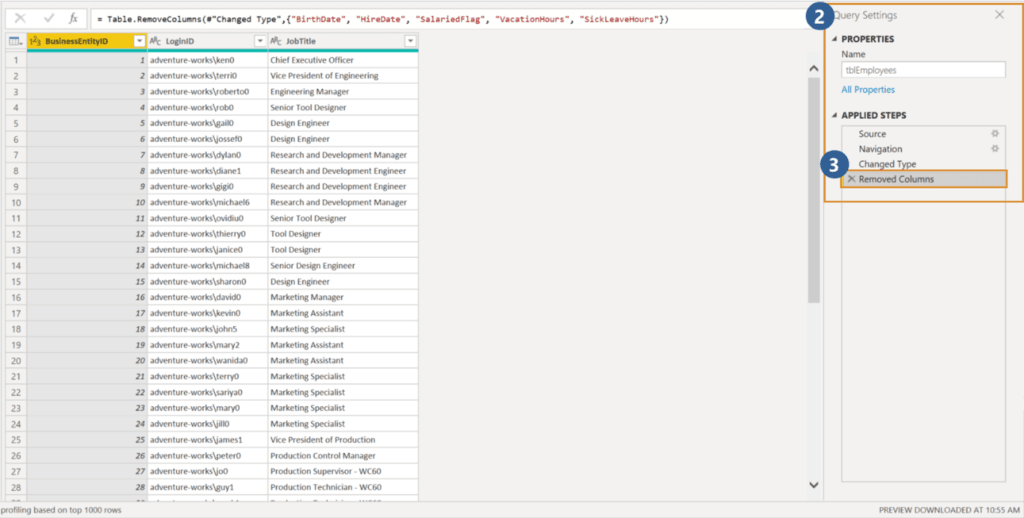
- Locate the Query Settings Pane on the right side of the Power Query Editor Window
- Click the X beside the Removed Columns entry on the APPLIED STEPS list. All the Removed Columns will reappear in the Dataset
Step Two: Remove the Columns
We will select the columns that we want and use the Remove Columns function to remove all the other columns from the table:
- Click the Header of the BusinessEntityID Column to highlight that column.
- Hold the CTRL key and click the headers of the following additional columns to highlight them all simultaneously:
- LoginID
- Job Title
- Locate the Remove Columns button on the Home Tab.
- Click the drop-down arrow.
- Choose Remove Other Columns from the drop-down menu.
Though the result of the two exercises appears the same, the second model is a more sustainable model. Because Power Query Editor is determining which columns to remove by removing any column that is not one of the three that has been selected, if more sensitive data is added to the model in the future, it will not be loaded into the model. This can be understood by looking at the M code that results from applying the Remove Columns function in these 2 different ways.
Exercise One M code:
= Table.RemoveColumns(#"Changed Type",{"BirthDate", "HireDate", "SalariedFlag", "VacationHours", "SickLeaveHours"})
Exercise Two M code:
You don’t need to know how the M code works to understand why this is important. You only need to know that the M code does not change. The same M code will be automatically applied to the data source every time the report is refreshed. Since the M code that is created by doing exercise two contains a list of columns to include, rather than a list to exclude, the table in the model will never include a column that is not on that list.
You can learn more about M code here.
Note: Be aware that if a column that Power Query Editor has been instructed to keep is deleted from the data source, then the data will fail to load properly into the model. There are methods to detect these changes. They are more advanced and can significantly increase the time and work that goes into creating the data model.
There is no way to create a data model that will never break when structural changes to the data are made. Keeping sensitive data safe should always be the priority. These issues can often be avoided by ensuring you communicate with the data owners, so they understand how the data source can and can’t be changed.
Bonus Exercise: Using the Choose Columns Function
Step One: Using the Choose Columns Function to Remove Columns in a Large Dataset
Sometimes in a very large dataset, it is cumbersome to manually select the columns that you want to keep in your dataset using the headers. The Choose Columns function allows us to achieve the same result using a list of columns in a dialog box.
First, we will undo the application of the Remove Other Columns function:
- Locate the Query Settings Pane on the right side of the Power Query Editor Window.
- Click the X beside the Removed Other Columns entry on the Applied Steps list.
Now we will apply the Choose Columns function:
- Locate the Choose Columns Button on the Home Tab
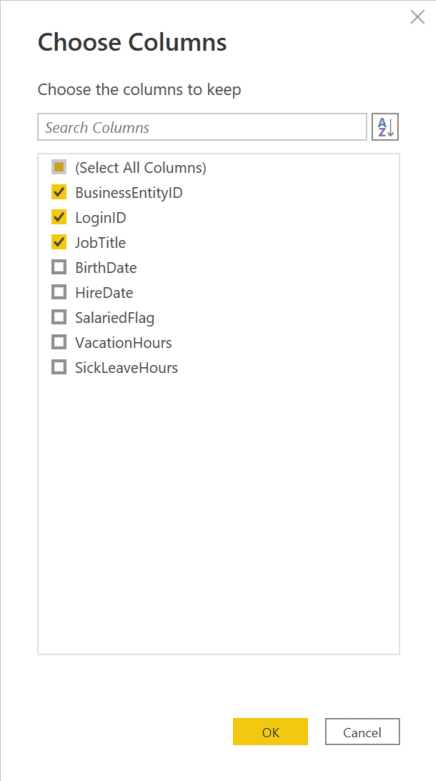
- Pick Choose Columns from the drop-down list. The Choose Columns dialog box will appear.
- Format the Choose Columns dialog box as shown below and click OK.
You will notice that the M Code produced by doing this is the same as the M Code produced in Exercise Two:
This means that both functions are doing the same thing, they are just done using a different path in the UI.
Step Two: Using the Choose Columns Function to Find Columns in a Large Dataset
You can also use the Choose Column function to find a column in your dataset:
- Locate the Choose Columns Button on the Home Tab
- Pick Go To Column from the drop-down list. The Go To Column dialog box will appear.
- Select the Column you want to find from the list and click OK.
The column you selected is now highlighted. This can be helpful when you are trying to find a specific column in a large dataset.
Wrapping Up
Removing unnecessary columns from your datasets properly is an easy way to ensure that your report is easy to use and that the sensitive data it contains remains protected. Ensuring that you are applying these practices to your reports will increase the longevity of your reports and reduce the upkeep of your report as it grows over time.
