
In this blog, we will explore the various tools and features available to Power BI administrators for effectively managing their tenants, such as workspace audit using the Usage Metric Report, The monitoring Hub, and Capacity Management.
Sections
- Introduction
- Why Use the Usage Metric Report
- How to Create a Usage Metric Report
- Create a Copy of the Usage Metric Report
- Admin Monitoring Workspace
- Conclusion
Why Use Usage Metric Report?
To Audit the workspace usage, a Metric report is a helpful report to analyze the reports in the workspace. This report helps to understand the impact of the reports in the workspace as it gives a clear view of the report usage breaking it down the pages of the reports. This report can also help developers understand the popularity of their report and their target audience.
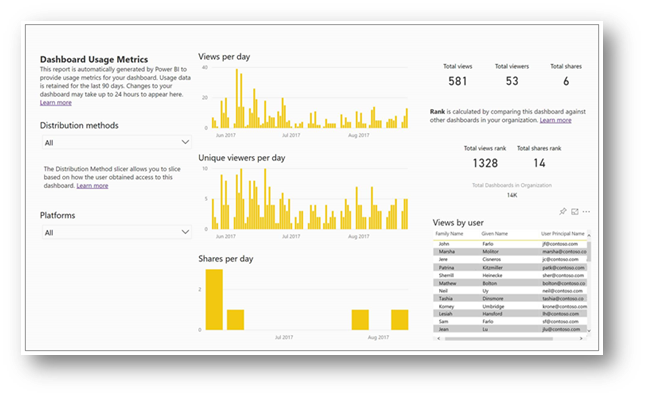
This report gives the following detailed information about the reports in the workspace.
- The timeline of the total views of the reports
- Views per day
- Unique views per day
- Viewer details
- Distribution Methods
- Most pages viewed in the report
Usage Metric Report
The Usage Metric Report is a valuable resource for Power BI admins, enabling them to conduct workspace audits. This report is read-only, but a copy can be made to create a regular report.
How to Create a Usage Metric Report
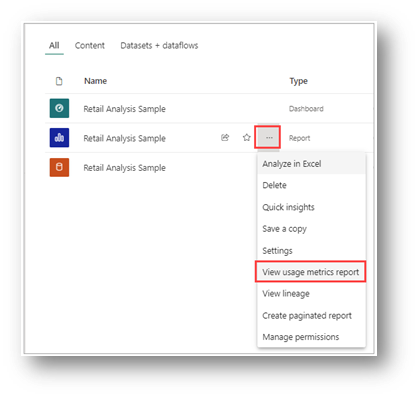
To create a usage Metric Report:
- Click on “More Options” 3 dots in any Report in the Workspace.
- Click on “View usage metrics report”
The Usage Metric Report will show the view of the selected report in the last 90 days.
Create a Copy of the Usage Metric Report
Save the copy of the usage metrics report to use as a regular report in your workspace.
- Click on the Edit button on the top to edit the report.
- Add the page to the report.
- On the new page users can see all the filters, visualizations, and data pane to build the report.
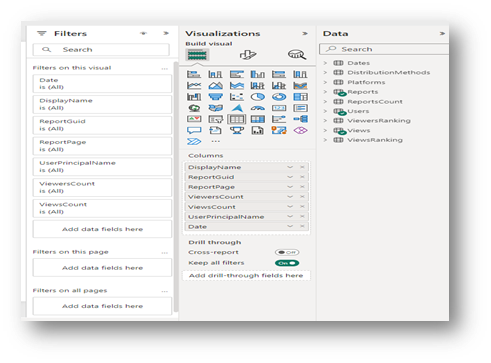
- Clear out any filters that you see in the filters pane.
- Expand the data in the Data pane to see the available data.
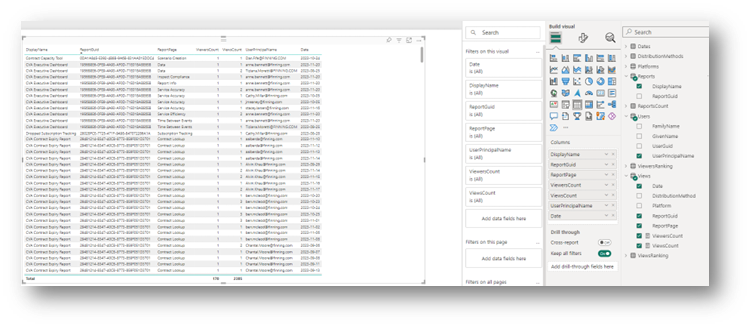
You can start building your report or check the usage of each report available in the workspace.
Admin Monitoring Workspace
The Monitoring Hub serves as a valuable tool for administrators, allowing them to oversee operations within Microsoft Fabric, including monitoring data refreshes, checking the refresh status and duration, and tracking the location of reports.
Creating an Admin Monitoring Workspace
- Login to Power BI service.
- From the left Pane, click on workspace.
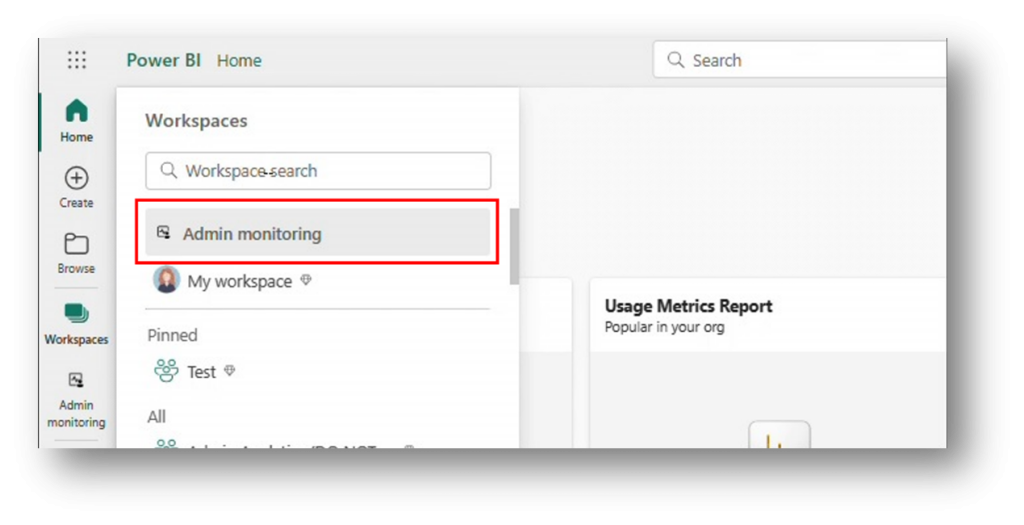
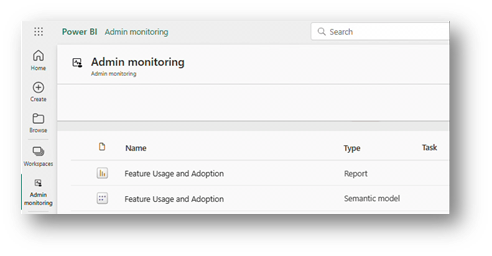
- Select Admin Monitoring.
- The following reports will show up.
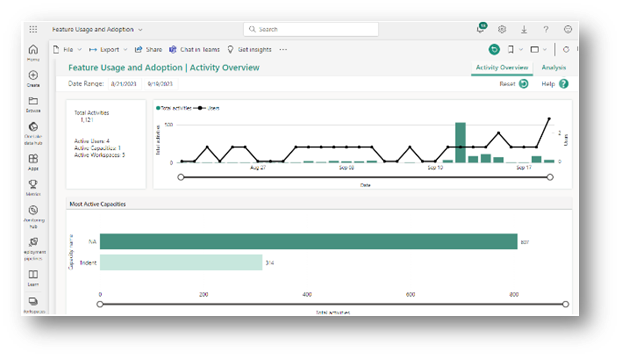
In the Feature Usage and Adoption Report, administrators have access to activity timelines, details on the most active capacities, and information on the most active users, among other insights.
Conclusion
In this blog, we covered various topics related to Power BI administration, including the usage metric report, creating a usage metric report, and the admin monitoring workspace. The usage metric report is a valuable tool for auditing workspaces, providing insights into report usage, and understanding the impact and popularity of reports. Overall, these resources empower Power BI admins to manage and monitor their tenants effectively.
