In recent years, AI and advanced analytics have been a hot topic. Many blogs out there talk about why you should be using advanced analytics in your organization.
With the amount of value that advanced analytics can bring, it is enticing to jump right in and try to get advanced analytics right away. But without the proper foundations, it is impossible to achieve these insights. So what is the first step to getting these valuable insights?
Understanding analytics progression will help to guarantee success. Especially with advanced analytics and lead to AI use.
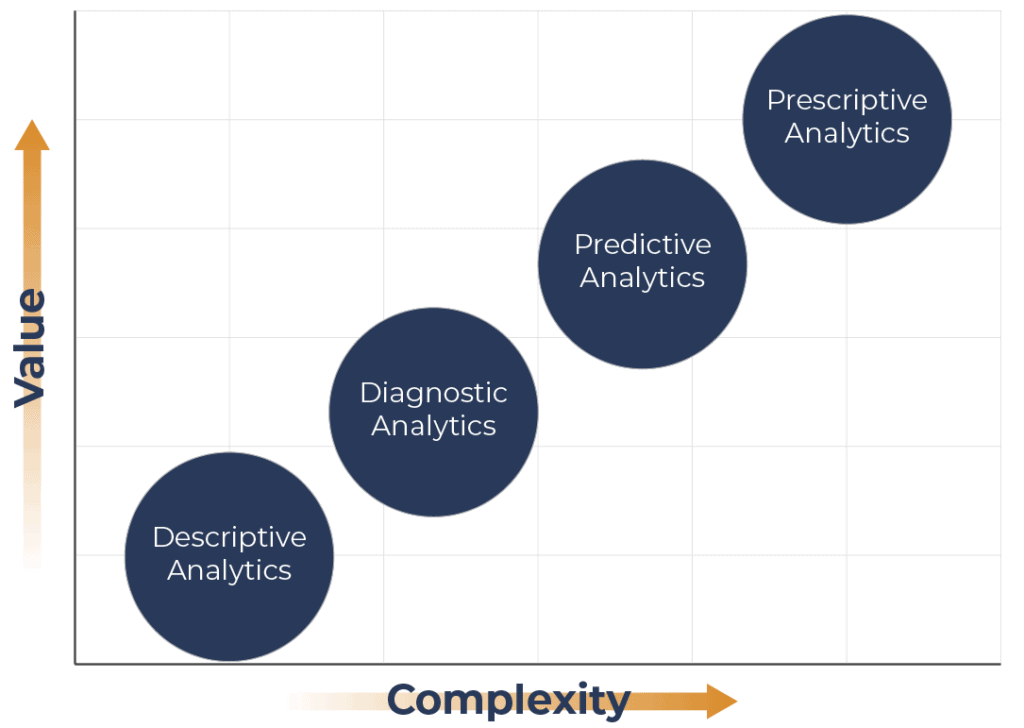
There are different types of analytics. These are Descriptive, Diagnostic, Predictive, and Prescriptive. The chart below outlines the levels of these four categories. It compares the amount of value added to an organization versus the complexity it takes to execute.
The idea is that you should start with the easiest to execute, Descriptive Analytics.
In this blog, we will review the four analytics types and an example of their use cases, and how they all work together.

Stay Up to Date with Our Latest Blogs
Subscribe to our mailing list to be notified when a new article is released.
Descriptive Analytics
What happened?
The baseline and the place that all organizations should start is with Descriptive Analytics. This type of analytics is when an assessment of data, often historical, is used to answer the fundamental question, “What happened?”
It looks at the events of the past and tries to identify specific patterns within the data. When someone refers to traditional business intelligence, they are often describing Descriptive Analytics.
Visualizations used for Description Analytics are pie charts, bar charts, tables, or line graphs.
This is the level to start your analytics journey, as it is the foundation of the other three tiers. To move further with your analytics, the answer to what happened must be found first.
An easy way to understand this is to look at some use cases in sales. For example, how many sales occurred in the last quarter? Did they increase or decrease?
The chart below shows sales from 12 months through this we can identify the trend of sales. Below you can see an increase in sales in October and December, with a decrease in November.
Diagnostic Analytics
Why did it happen?
The next step in analytics is Diagnostic, a form of advanced analytics that examines data or content to answer the question, “Why did it happen?” It is described by techniques such as drill-down, data discovery, data mining, and correlations.
This is the second step, as you must first understand what happened to be able to identify why it happened. Once an organization achieves descriptive insights, it can apply diagnostics.
Going back to the same example of sales transactions within a particular period. We once again have this traditional bar chart, but when you hover over it, you can see a breakdown by segment. You can now see which segments contributed the most to an increase in sales.
We can see that in November, an increase in sales occurred and that the Government segment contributed the most to this increase in sales during that period.
Predictive Analytics
What is likely to happen?
Once an organization can understand what occurred and why it happened, it can move up to the next tier in analytics. Predictive Analytics is another type of advanced analytics that looks to use data and information to answer the question, “What is likely to happen?”
The step between Predictive Analytics and Diagnostics Analytics is a big one. Predictive Analytics involves techniques. It includes regression analysis, forecasting, multivariate statistics, pattern matching, predictive modelling, and forecasting.
These techniques are harder for organizations to achieve. This is because they need large amounts of high-quality data. These techniques need a deep understanding of statistics and programming languages such as R and Python.
Many organizations may not have access to the expertise needed to implement a predictive model.
So why would any organization want to bother with it? Although it can be hard to achieve, the value that Predictive Analytics can bring is immense.
For example, a Predictive Model will suggest the impact of the next marketing campaign on customer engagement using historical data. If a company can identify which action caused a certain result, it can predict which actions would achieve the desired result.
These kinds of insights are helpful in the next step of analytics.
Struggling with your analytics journey?
Let Iteration Insights get you on the right path, view our services to see how we can help you today.
Prescriptive Analytics
What should be done?
The final level and most advanced level of analytics is Prescriptive.
Prescriptive Analytics is a method of analytics that analyzes data to answer the question, “What should be done?”
This type of analytics is characterized by techniques. These include graph analysis, simulation, complex event processing, and neural networks. It also includes recommendation engines, heuristics, and machine learning.
This is the most difficult level to achieve. The reliability of Prescriptive Analytics depends heavily on the accuracy of the three levels of the analytics below. To get an effective response from a prescriptive analysis, the techniques required stem from how well an organization as has accomplished each level of analytics.
That being said, this is not an easy task considering the quality of data needed. The appropriate data architecture to simplify it and the expertise needed to execute this architecture.
The value that it brings is that an organization will be able to make decisions based on analyzed facts rather than instinct.Meaning they are more likely to guarantee the desired result, such as increasing revenue.
Once again, a use case for this kind of analytics in marketing would be to help marketers understand the best mix of channel engagement is appropriate. For example, which segment is best reached through email?
Conclusion

Going on an analytics journey requires an understanding of the four types of analytics.
Descriptive analytics analyzes historical data to understand past events, patterns, and performance.
Diagnostic analytics investigates the reasons behind patterns through techniques like root cause analysis.
Predictive analytics uses statistical models and machine learning. This is to forecast future outcomes and identify risks and opportunities.
Finally, prescriptive analytics recommends optimal actions based on insights from previous stages, guiding decision-making and resource allocation.
Struggling With Your Analytics Journey?
If you find yourself struggling on your analytics journey, Iteration Insights is here to assist you.
Our services are designed to help organizations at every stage of their analytics adoption. By using our expertise and industry best practices, we can guide you on the right path and ensure you extract maximum value from your data.
Don’t let the complexities of analytics hinder your progress.
Contact Iteration Insights today! Discover how our services can empower you to unlock the full potential of your data and drive meaningful business outcomes.
For data analytics consulting, contact us.
Struggling with your analytics journey?
Let Iteration Insights get you on the right path, view our services to see how we can help you today.


