Introduction to Power BI Paginated Reports

2 Half Day Live Webinar
Instructor-Led

This instructor-led Power BI course is focused on introducing users to the fundamentals of building paginated reports in Power BI Report Builder.

Users will be guided through an end-to-end report building process using a combination of lectures, demos, and hands on labs. By the end of the course users will understand:

  • How to create a paginated report in Power BI Report Builder.
  • How to connect Power BI Report builder to their existing datasets on the Power BI service.
  • The use cases and role paginated reports play in the analytics environment.

Introduction to Power BI Paginated Reports

Microsoft Teams Virtual Meeting, Canada

Whether you are seeking to create and share printable reports, build documentation in a repeatable format, or export large volumes of report data to excel, this course will introduce you to the fundamentals of creating Paginated reports for the Power BI service.

$299 CAD

About Our Power BI Course

Course Objectives

By the end of this course participants will build a Paginated report from end-to-end using an existing dataset stored on the Power BI Service. They will also be introduced to the fundamental functions of the Power BI Report Builder and the uses of Paginated Reports.

Duration

This is a 2 half day course that runs from 9 am to 12:15 pm MST with time built in for asking questions.

Prerequisites

While there are no prerequisites, this course builds upon the business scenario used in the Introduction to Power BI course and can be taken as a standalone course or as a supplement to our introduction course. 

Course Set Up

Download the latest version of Microsoft Power BI Report Builder and get access to Power BI Service by signing in to powerbi.microsoft.com with your work or school email.

Location

This course is currently only available online. Our online courses are run in Mountain Time and can be accessed around the world. When in-person events are available, our locations are Calgary and Edmonton.

What do I take next?

If you are looking to learn how we built the dataset used in this course or to start working with Power BI Desktop, we suggest starting with our Introduction to Power BI course.

Individual

Our Power BI Paginated Reports course is individuals who want to broaden their data analytics techniques. There are no prerequisites for this course but previous experience with an analytics tool such as Excel is an asset.

Sign up and go further with your analysis while learning how to tell a story with your data!
Register Now

Group

Are you a group of two or more?

If you and a colleague are looking to improve your Power BI skills, get a 20% discount for signing up together.

Select the Group Attendees tickets at checkout to get the discount.
Register Now

Corporate

Are you an organization looking for personalized Power BI training that suits your business goals and works with your schedule?

Our training is ideal for 7-15 people per course and is currently completely virtual.

Contact us today to find out more!
Contact Us

Accelerate Your Insights With Our Power BI Training​

Power BI is a unified self-service & enterprise Business Intelligence platform.

It is the leading data visualization and interactive reporting tool from Microsoft, focused on aiding users to connect, analyze, visualize their data and publish and collaborate on reports.

Learn Power BI to empower your organizations analytics to get results faster, become more strategic, and work together more effectively.

Meet Our Instructors

A man in glasses donning a purple shirt.

Chris Sorensen

Chris Sorensen CPA, CGA, is the Founder and President of Iteration Insights, a tech-enabled data analytics solutions provider based in Calgary, Alberta. 

He is a Microsoft Certified Data Analyst Associate and Microsoft Certified Trainer with a combined 20+ years of industry and teaching experience. As an adjunct instructor of the Business Intelligence program at SAIT, he plays a significant role in shaping new talent in Calgary’s emerging tech sector. Following his lifelong learning approach, Chris also coordinates both Power Platform and Azure Analytics User Groups, providing a space dedicated to knowledge-sharing and growing Alberta’s tech community. His favourite hashtag is #neverstoplearning.

A man wearing glasses and a blue shirt, exuding professionalism and intelligence, confidently poses for the camera.

Jarid Mckenzie

Jarid McKenzie, BSc. in Math and Statistics and certified in Business Intelligence from the University of Calgary, is co-owner and Lead Analytics Architect for Iteration Insights.

Jarid has eight years of experience working in the digital space, including teaching Business Intelligence at the University of Calgary and the Southern Alberta Institute of Technology (SAIT). Currently, he is on the advisory board for the Business Intelligence Program at SAIT and is a mentor to many graduates from this course. As an active member of the Power Platform and Azure Analytics User Groups in Calgary, Jarid loves to share his knowledge with the community by speaking at major data analytics events, such as the Power Platform World Tour held in Calgary last year.

A man wearing glasses and a white shirt exudes professionalism and intelligence.

Tutu Hamid

Tutu is a Senior Analytics Consultant and Microsoft Certified Instructor at Iteration Insights.  As well as, an active member of the Power BI Super User Group.

He acquired his Master’s degree in Microsystems Technology in Germany and in 2018 he decided to pivot into Data Analytics. His primary focus is Microsoft Power BI with experience in the Enterprise Deployment, Development, and Governance. He also leads corporate and public Power BI trainings and teaches data analytics at SAIT. For fun, Tutu enjoys solving DAX challenges. And when Calgary’s snow melts, he is probably out riding bicycles in Moose Mountain or other bike parks in BC.

Chinazom Eloji

Chinazom Eloji is a Analytics Consultant at Iteration Insights.

Chinazom has a Bachelor’s of Science in Geological Sciences, Master’s of Science in Petroleum Geosciences and a postgraduate certificate in Business Intelligence and Data Analytics from Southern Alberta Institute of Technology. 

She is very passionate about diving into data to produce actionable insights to help make data drive business decisions.

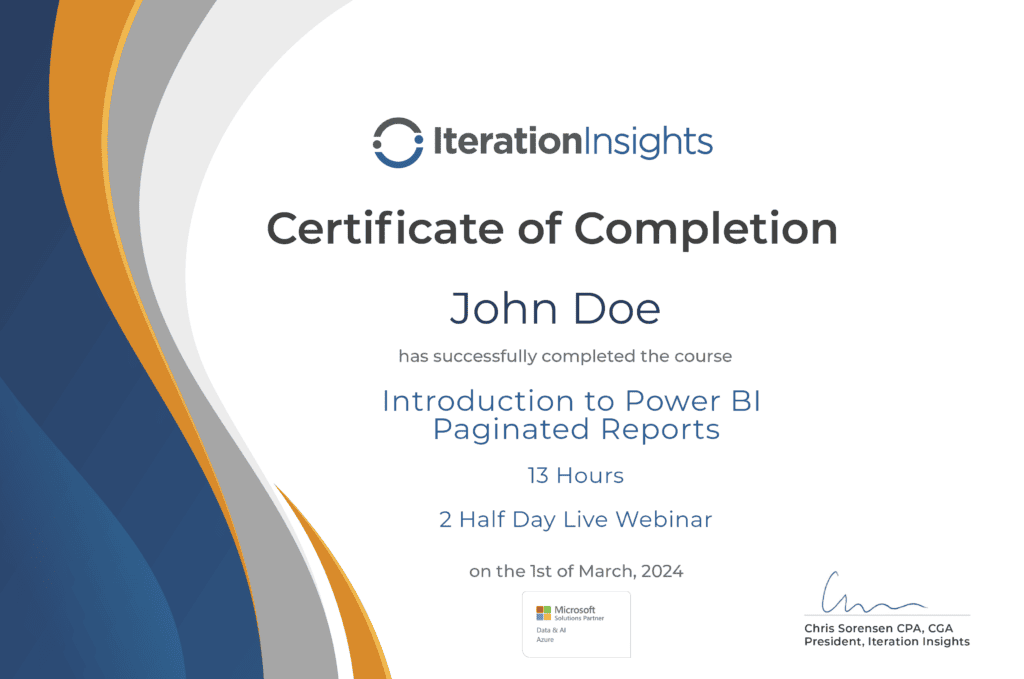
Earn a Certificate

Our Introduction to Power BI Paginated Reports training course provides a detailed understanding of the functionalities of generating printed and PDF reports within Power BI. Upon course completion, you will receive a certificate that recognizes your significant progress in mastering the full range of capabilities in Power BI.

Share Your Achievement

Talk about it on Linkedin, Twitter, Facebook, boost your resume or frame it – tell your friends and colleagues about it.

Introduction to Power BI Paginated Reports

Intermediate Power BI

Microsoft Teams Virtual Meeting, Canada

Take your Power BI Skills to the next level! This hybrid instructor-led course is perfect for those who have been using Power BI for 3-6 months. In this course, we will expand upon basic Power BI concepts such as transforming and cleansing data using Power Query Editor, writing basic DAX expressions, and publishing dashboard visualizations to end-users.

$599 CAD

Get started with training

Let's get started with a consultation