

“Happy Hunger Games! And may the odds be ever in your favor.”
Suzanne Collins, The Hunger Games
Introduction
Power BI is a very capable tool in descriptive and diagnostic analytics. It is easy to create a report displaying the current or past state of a business with the ability to explore the reasons behind a given outcome. The next levels of analytics are the predictive and prescriptive levels which try to predict what will happen and what you should do about it.
Basic Power BI does not have any support for these levels, but there are several ways to add them. You can use R and Python in Power BI to extend Power BI and add machine learning. Power BI Premium includes Auto Machine Learning, but it can be financially prohibitive.
If you do not know R or Python and do not have access to Premium capacity, there are ways to do some simple ‘machine learning’ inside Power BI using only DAX. This can be done by creating a Naive Bayes predictive model in Power BI.
Sections
- Introduction
- What is a Naive Bayes Predictive Model?
- Data and Setup
- Building Your Model Using Measures
- Validating Your Model
- Conclusion
What is a Naive Bayes Predictive Model?
Naive Bayes is a statistical method for predicting the probability of an event occurring given that some other event(s) has also occurred. Below are formulas displaying the math we will be using.
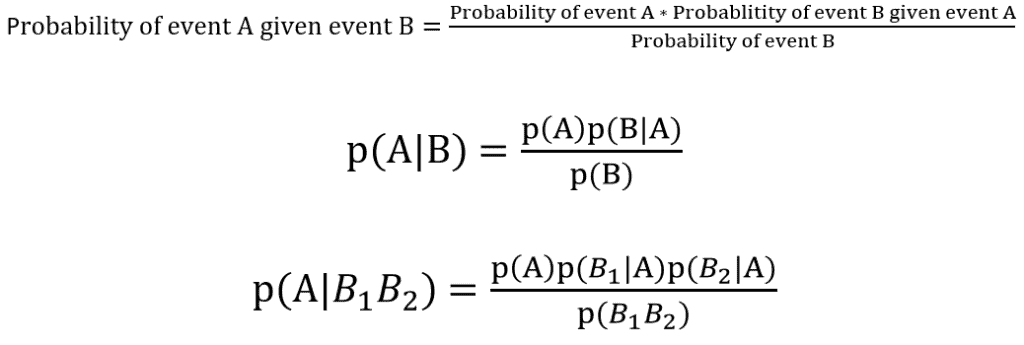
The first formula provides the variables as they are written in plain English. Assume there are two events, A and B. We want to know the probability of event A happening if event B also happens. To calculate this, you can use historical or training data.
First, we calculate the probability of event A happening, irrespective of any other events. Multiply that by the probability of event B happening when event A also happens. Then divide by the probability of event B happening.
This is summarized in the middle equation using more standard mathematical notation.
The third equation expands the middle one for two dependent events. Here, the probability of event A is dependent on two events, B1 and B2. This is the form of the equation we will use below. We will have to calculate both the probability of each B1 and B2 happening if A happens and the probability of B1 and B2 happening together.
Data and Setup
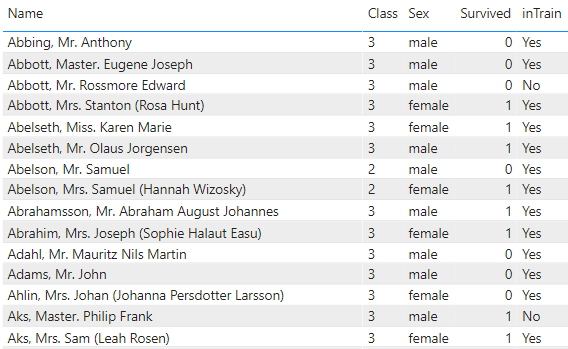
For this demonstration, I am going to use the Titanic dataset. This is a dataset of all the passengers on the Titanic. It includes information about the passengers and whether they survived or died from the sinking.
This is a common dataset for learning machine learning. Partly because it is small, but also because the outcome is easy to predict using only a passenger’s sex and class. For instance, over 95% of first-class females survived, whereas only 15% of third-class males survived.
I randomly classified 80% of the passengers as training data. In machine learning, you use training data to assign values to the parameters of the equation. In our case, the training data is used to calculate the values of the variables on the right-hand side of the above equations. I will use those values to predict the survival of passengers in the test data.
In a real-world application, the training data would be all the historical data in the report. As a result, a report like this would have data for descriptive and diagnostic analysis, while giving some predictive capabilities.
All of the data is in one table with an ‘inTrain’ column to parse out the passengers in the training set. Other important columns are the class, sex, and survived columns. See the image below for a sample of the data.
Building Your Model Using Measures
In this demonstration, I am going to build up the model using measures. There will be measures for each of the variables in the equation.
Written in plain English below is an example of a calculation we need to do to predict the survival of a 2nd class male:

From the training data, we need measures that calculate:
- The total probability any passenger survived
- From the passengers who survived
- What fraction were 2nd class
- What fraction were male
- The probability a passenger was both male and 2nd class
To get started, I created a couple of DAX measures to calculate the number of passengers in the training set, and the number of those who survived.
The first measure is the probability of any passenger surviving. Which is just the number of passengers who survived, divided by the number of passengers.
Then I created a measure to calculate the odds a passenger is part of a certain class, given they survive. This measure determines a passenger’s class, then counts the number of passengers who were also in that class and survived. Finally, dividing that number by the total number of survivors.
Then the odds of being a certain sex and surviving. The logic is similar to the above measure, just using sex instead of class.
In the denominator, I calculate the total probability a passenger is both a certain sex and class.
All of these measures then got put together into one final measure to give the probability of survival.
Validating Your Model
Once you have a model, the next step is to validate it to see how effective it is. For this reason, I left 20% of the passengers out of the training set. These are in the test set and will be used for validation.
The output of the model is a probability with values from 0 to 1. Higher values predict survival and lower values predict death. However, this value is relative to the dataset. We need to determine what point in this value range most accurately represents the threshold between a high and low probability of survival by testing it.
To make a decision, we need to assume a dividing, or threshold, value in the probability range. Probabilities above that threshold predict survival, while those below predict death.
To begin, I will make a table, like a ‘what if’ parameter, with a range of possible threshold values.
Then I created a measure that will use the values of this table to evaluate the accuracy of a prediction for a given threshold value. This measure will iterate over the test set and evaluate the model for each passenger. If the passenger is predicted to survive and did so, then it is a true positive.
Similarly, it classifies passengers who died and had a probability below the threshold as true negatives. The opposite of a true positive and negative is a false positive or negative. This is when the model is predicting the opposite of what happened.
We can then use this measure in a line chart.
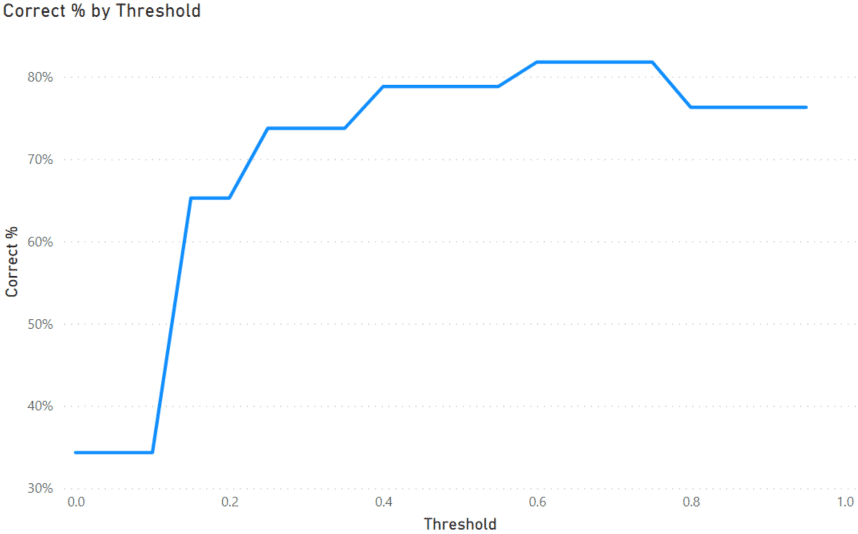
As we can see on the graph, if we assume a threshold of about 0.7, we can accurately predict the outcome of over 80% of the passengers. So this model does a pretty good job of predicting a passenger’s mortality.
In a real-world scenario, you would have to determine what level of accuracy is acceptable. No model will ever be 100% correct, but that is often not necessary to be valuable.
Conclusion
In this blog, I have shown how to implement a simple Naive Bayes predictive model in Power BI using nothing but DAX. I hope this will be helpful to you with your reporting. This type of approach can be very useful to quickly create simple predictive models in Power BI and take your reporting to the next level.