
Those who have knowledge, don’t predict. Those who predict, don’t have knowledge.
– Lao Tzu
Sections
- Introduction
- Example
- Training and Tuning the Models
- Tuning Results
- Using the Model in Power BI
- Conclusion
Introduction
In Microsoft’s data world, there are a number of ways to do machine learning and consume predictions made by your models.
Azure Machine Learning is the machine learning hub on Azure. Azure Machine Learning is a cloud-based platform designed to expedite and oversee the various stages of a machine learning project’s lifecycle. Here, you can do machine learning with languages like Python; use a visual, no-code editor; or even let it do all the work for you with AutoML.
In 2016, SQL Server introduced the ability to run external scripts. This ability was then re-branded in 2017 as SQL Server Machine Learning Services, which allows for an almost limitless number of languages to be run within SQL Server using the sp_execute_external_script stored procedure.
Also introduced in 2017, the PREDICT function was added to the T-SQL language as a way to consume trained models using only SQL without resorting to another language. This allows end users who know SQL but not other languages like Python or R to use models created by Data Scientists.
Models used with PREDICT need to be created using the RevoScale algorithms (R, Python). Once a model is trained, it can be saved in binary form in the database. PREDICT can then use this model to create a prediction based on new data.
In this blog, I am going to use these SQL Server tools to create, tune, and use a machine-learning model, analyzing the results with Power BI.
Example
Training and Tuning Models
The data I’m using for this post is the Wisconsin Breast Cancer data set. This dataset provides data about the number of tumours and whether they are malignant or not.
For the model, I am using the rx_btrees algorithm from the Revoscalepy library, which is a boosted decision tree algorithm. This algorithm creates a number of decision trees. Each tree may not be the greatest model on their own, but a collection of them can create very accurate models.
One of the steps in creating a machine learning model is tuning the model. Every algorithm has variables that can be changed to make the model more accurate for the data. Two of the variables I will be tuning are ‘n_tree,’ which sets the number of trees, and ‘max_depth,’ which sets the maximum number of levels a tree can have.
The ‘correct’ values for these parameters can only be determined with testing. This means training a model with a set of parameters and testing it. Then training with different parameters and so on.
Doing this tuning in SQL Server makes it easy to store the tuning results and then analyze what is going on in Power BI. Power BI is a business intelligence and data visualization tool developed by Microsoft. It allows users to easily connect, transform, and visualize data from various sources in a user-friendly interface.
It provides more advanced features and data manipulation tools as compared to other BI tools like Tableau. Power BI’s user interface, which is based on Microsoft Office 365 and is already familiar to many end-users, gives it an advantage over Tableau in terms of ease of use.
With Power BI, users can create interactive reports, dashboards, and visualizations to gain insights and make informed decisions based on data.
Below is the script I used to tune the model. It loops through a range of parameters and tests each model. Comments in the code will provide details on what is going on.
-- Models are stored temporarily as variables
DECLARE @trained_model varbinary(max);

-- Initial values for parameters and the start time of the run
DECLARE @n_tree int = 10;
DECLARE @max_depth int = 1;
DECLARE @CurrTime datetime = CURRENT_TIMESTAMP;

------------
-- Main loop. Will terminate when @n_tree parameter exceeds a certain value.
------------

WHILE @n_tree < 101
BEGIN

---------------------
-- Training the model
---------------------

-- Creating the training python script with changable parameter values.
-- Note. '#' denotes a comment line in python code
DECLARE @Python_Script nvarchar(max);
SET @Python_Script = CONCAT(N'
## Import libraries
from revoscalepy import rx_serialize_model, rx_btrees

## Train model
## Trying to predict Malignant based on the rest of the columns
## n_tree and max_depth are added as variables
forest_model = rx_btrees("Malignant ~ ClumpThickness+UniformityofCellSize+UniformityofCellShape+MarginalAdhesion+SingleEpithelialCellSize+BareNuclei+BlandChromatin+NormalNucleoli+Mitoses",
                train, n_tree = ', @n_tree, ', max_depth = ', @max_depth, ', method = "class")

## Serializing the model allows it to be exported and used by PREDICT
trained_model = rx_serialize_model(forest_model, realtime_scoring_only = True)
    '
    )

-- Running the python script
EXECUTE sp_execute_external_script
    @language = N'Python'
    ,@script = @Python_Script
    ,@input_data_1 = N'SELECT [ClumpThickness],[UniformityofCellSize],[UniformityofCellShape]
                              ,[MarginalAdhesion],[SingleEpithelialCellSize],[BareNuclei]
                              ,[BlandChromatin],[NormalNucleoli],[Mitoses]
                              ,CASE WHEN Class = 2 THEN 0 ELSE 1 END AS Malignant
                        FROM [PredictDemo].[dbo].[breast-cancer-wisconsin]
                        WHERE [Key] % 2 <> 0'
    ,@input_data_1_name = N'train'
    ,@params = N'@trained_model varbinary(max) OUTPUT'
    ,@trained_model = @trained_model OUTPUT;

-- Storing the model and metadata in a table
INSERT dbo.the_models (n_tree, max_depth, model, duration)
VALUES (@n_tree, @max_depth, @trained_model, DATEDIFF ( second , @CurrTime , CURRENT_TIMESTAMP )  )

SET @CurrTime = CURRENT_TIMESTAMP;

---------------------------------
-- Testing the model with PREDICT
---------------------------------

-- Creating test dataset
-- The Test/Train datasets are based on the 'Key' column using a 50/50 split
;WITH dat AS (
    SELECT [ClumpThickness],[UniformityofCellSize],[UniformityofCellShape]
            ,[MarginalAdhesion],[SingleEpithelialCellSize],[BareNuclei]
            ,[BlandChromatin],[NormalNucleoli],[Mitoses]
            ,CASE WHEN Class = 2 THEN 0 ELSE 1 END AS Malignant
    FROM [PredictDemo].[dbo].[breast-cancer-wisconsin]
    WHERE [Key] % 2 = 0
)

-- Using PREDICT and storing the results
INSERT INTO dbo.the_results
SELECT @n_tree, @max_depth, d.Malignant, p.Malignant_prob
    FROM PREDICT(MODEL = @trained_model, DATA = dat as d)
    WITH(Malignant_prob float) as p

-- Updating parameters
IF @max_depth = 8
    SET @n_tree = @n_tree + 10;

IF @max_depth = 8
    SET @max_depth = 1;
ELSE
    SET @max_depth = @max_depth + 1;

END
Tuning Results
The script above goes through a range of values for both n_tree and max_depth. The best values of these parameters are always dependent on the data. One dataset can work well with one set of parameters, and another will need another for optimum results.
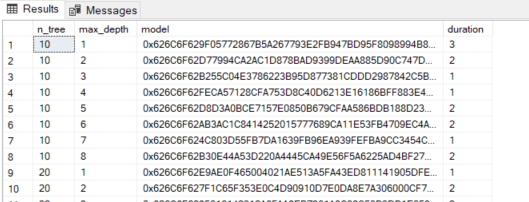
The results of the tuning are stored in two database tables. Here is the model’s table that stores the parameters, the model, and approximately how long the training and testing took.
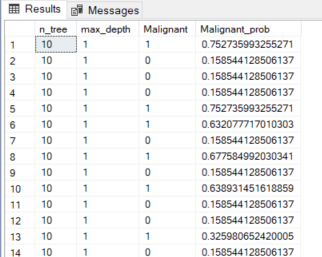
For each model, I also ran a test using the PREDICT function. This table has the parameter values, the actual result for each row (Malignant), and the model output as a probability (Malignant_prob).
In a prior blog post, I cover several ways to validate and test how well a machine-learning model is performing. Here, I will use the accuracy calculation to see how well the models are doing.
Accuracy results for several models are shown below. On the left, models with 10 trees are shown, and 100 on the right. Each then shows the range of tree depth.
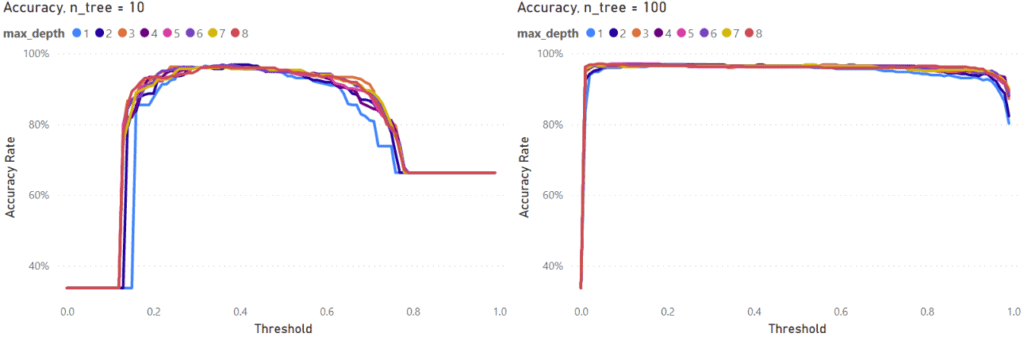
The results show that models with only 10 trees can achieve similar accuracy as 100 trees but for a narrower threshold range.
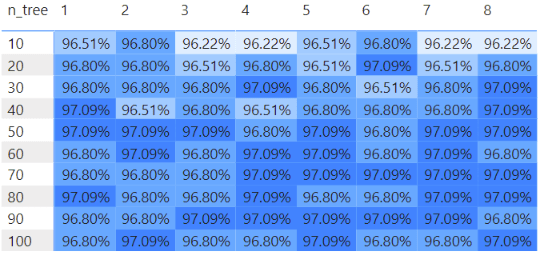
I made a visual to see the maximum accuracy for each model. The number of trees goes down the side, and the depth of the trees is the columns. All the models do show very similar maximum accuracy in this case.
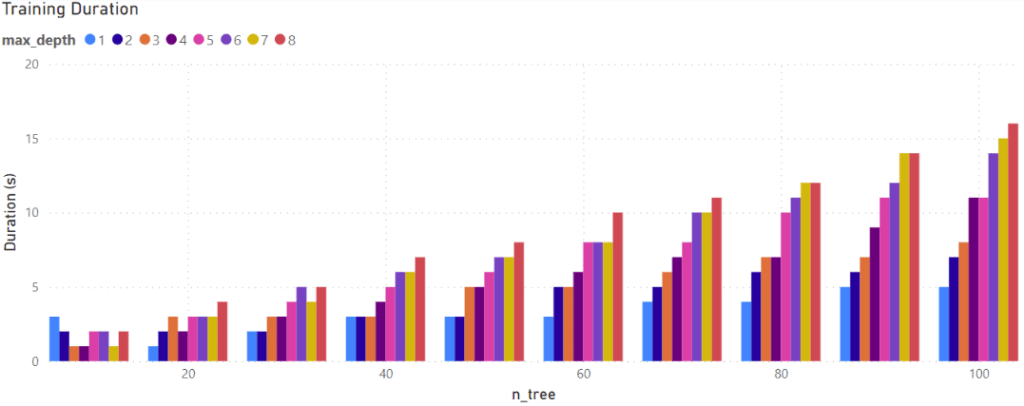
While the results are similar, there is a difference in how long it took to train each model. Models with more and larger trees took longer to train.
While the training times here are small, for larger datasets with more complex models, processing or even multiple models can take a lot longer to train. Depending on your use case and how often your model is going to be re-trained, training time can be an important factor.
Using the Model in Power BI
By using a machine learning model, new data can be processed through the model to generate predictions, which can then be utilized.
One efficient method to achieve this involves creating a stored procedure that utilizes the PREDICT function to insert the prediction results into a table, much like the tuning script outlined previously. The predictions table can be seamlessly incorporated into Power BI, allowing for further analysis and visualization of the model’s outputs.
This process effectively integrates a range of features, combining the capabilities of Power BI’s Business Intelligence tools with the predictive power of machine learning models.
Another use case is on-demand predictions using Power BI in Direct-Query mode. Using the Power BI Service in Direct-Query mode could be useful in situations where data is updated frequently and predictions are needed on demand.
The first step is to create a Table Valued Function in the database. Inside the function, the desired model is stored in a variable before being passed to the PREDICT function along with data for predictions to be run on.
CREATE FUNCTION [dbo].[get_prediction]
(
-- Input values to select the desired model
@n_tree int, @max_depth int
)
RETURNS @ResultTable TABLE
(
    SampleCodeNumber int
    ,ClumpThickness int
    ,UniformityofCellSize int
    ,UniformityofCellShape int
    ,MarginalAdhesion int
    ,SingleEpithelialCellSize int
    ,BareNuclei int
    ,BlandChromatin int
    ,NormalNucleoli int
    ,Mitoses int
    ,Class int
    ,Malignant_prob float
) AS
BEGIN
    -- Get the model binary object
    DECLARE @model varbinary(max) = (
        SELECT model
        FROM dbo.the_models
        WHERE n_tree = @n_tree AND max_depth = @max_depth);

    WITH dat AS ( -- Input data for prediction
    SELECT SampleCodeNumber, [ClumpThickness],[UniformityofCellSize],[UniformityofCellShape]
            ,[MarginalAdhesion],[SingleEpithelialCellSize],[BareNuclei]
            ,[BlandChromatin],[NormalNucleoli],[Mitoses]
            ,CASE WHEN Class = 2 THEN 0 ELSE 1 END AS Malignant
    FROM [PredictDemo].[dbo].[breast-cancer-wisconsin]
    WHERE [SampleCodeNumber] % 2 = 0
    )

    -- Get the results and insert them into the returned table
    INSERT INTO @ResultTable
        SELECT d.*, p.*
            FROM PREDICT(MODEL = @model, DATA = dat as d)
            WITH(Malignant_prob float) as p
RETURN
END
GO
Getting predictions can then be done by running a query like the one below.
SELECT
    SampleCodeNumber
    ,ClumpThickness
    ,UniformityofCellSize
    ,UniformityofCellShape
    ,MarginalAdhesion
    ,SingleEpithelialCellSize
    ,BareNuclei
    ,BlandChromatin
    ,NormalNucleoli
    ,Mitoses
    ,Class
    ,Malignant_prob
    ,ROUND(Malignant_prob, 2) AS Bin
FROM dbo.get_prediction(10, 1)
The above query passes two parameters to the function to select the model to use. These parameters can be passed from Power BI and selected using slicers into the SQL query.
In Power Query, I created two parameters for n_tree and max_depth and bound them to columns in the data already loaded into Power BI. Then, I added the parameters to the SQL query by editing the M code in Power Query.
Power Query utilizes a recently developed programming language known as M-code. Power Query’s primary purpose is to combine data from a compatible source with another. This language is user-friendly and shares many similarities with other programming languages.
let
    Source = Sql.Database("localhost", "PredictDemo", [Query="SELECT SampleCodeNumber,ClumpThickness,UniformityofCellSize,UniformityofCellShape,MarginalAdhesion,SingleEpithelialCellSize,BareNuclei,BlandChromatin,NormalNucleoli,Mitoses,Class,Malignant_prob,ROUND(Malignant_prob, 2) AS Bin FROM dbo.get_prediction(" & Number.ToText(n_tree) & "," & Number.ToText(max_depth) & ")"])
in
    Source
Then, I can use Direct Query to get predictions in Power BI.
Here is a quick page I made to show how I used Direct Query to get the predictions in Power BI. It has a table with the sample number and the prediction and three slicers. The first two slicers allow me to select the model I want and get the predictions from SQL Server. The third slicer selects a threshold value that controls the colour coding of the table.
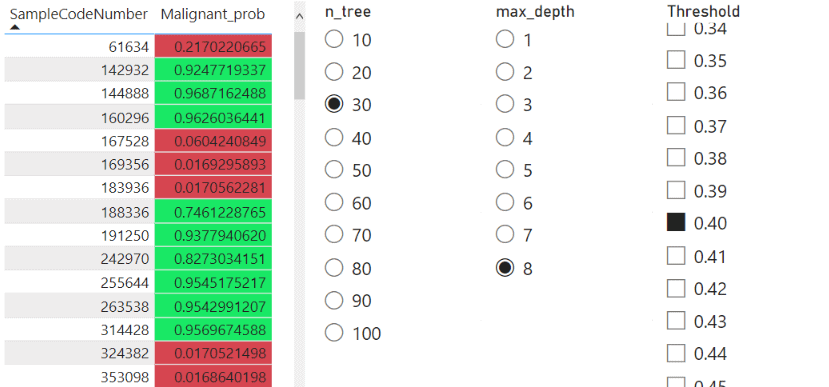
There are a lot of options one could use this for. You could pass parameters not just about the model but also what data to run the predictions on (Date ranges, for example).
Conclusion
Although it is often overshadowed by things like Azure ML, SQL Server Machine Learning Services is a capable platform for running machine learning on data. The PREDICT function in the T-SQL language makes it very easy to consume models for those who are familiar with SQL or without code in Power BI.
The PREDICT function is available in SQL Server, Azure SQL, and Synapse (Dedicated pools only), and SQL Server Machine Learning Services is available in SQL Server and Azure SQL Managed Instance.
So there are a couple of places you can use this, and you may also have them available without having to create new resources.
Explore our website for more articles and videos on Azure, Power BI, Power Platform, and Tableau to keep up with the latest trends and updates!
Discover the power of data-driven decision-making with Iteration Insights. Visit our website to learn more about our services and see how we can help your business grow. Get in touch with us today and start unlocking the full potential of your data!
