
“Automation may be a good thing, but don’t forget that it began with Frankenstein.”
– Anonymous
A while back I was sitting in a Power Platform User Group meeting listening to a presenter talk about some of the new features coming to Power BI. One of the things which caught my eye was this new feature called Automatic Machine Learning, Auto-ML. He was showing us a data flow, then a screen that showed a selection of several different types of machine learning: Regression, classification (binary and multi-class), and clustering.
I could not believe it. I had spent considerable time working on machine learning in the past (often as part of a Kaggle competition), and here was all the work I had done available with the click of a few buttons. Of course, I then wondered how good such a process would be. Could it beat a human? A good human?
That is what I will be trying to explore in this post. Auto-ML is available outside of Power BI Premium as part of the Azure Machine Learning suite, which is what I used for this blog.
Sections
Data
For this experiment, I downloaded a couple of data sets from Kaggle. Kaggle is a website that hosts Machine Learning competitions for people who want to learn, compete for prizes, or have fun.
The two data sets used are from the Housing Prices and Digit Recognizer competitions. They are part of several introductory competitions for users new to machine learning. Competitors can try them anytime to see how they rank against many other users worldwide.
The Housing Prices dataset provides information about Russian houses with the goal of predicting the sale price of the house. This is an example of Regression machine learning where the goal is to predict a numerical value.
The Digit Recognizer is an example of Multi-Class Categorization. The data comes from the MINST database which is a collection of thousands of handwritten digits. Each image is the same size, and each pixel forms one column of the dataset. In this case, there are several possible outcomes for the data and the goal is to classify which outcome each row in the data maps too.
Training and Testing
Kaggle competitions provide a training dataset for developing a machine learning model and a test set for creating the submission file. The test set does not contain the results for the data. Instead, a user has to run the data through their model, then upload the results to Kaggle for scoring.
A machine learning model is an algorithm that accepts data and produces a result/output based on that data. There are many different types of models with their strengths and weaknesses. Training a model turns it from a general algorithm to one which is customized to a dataset and capable of producing predictions.
To train my models, I used Azure Auto-ML. This is part of Azure Machine Learning and will do most of the tasks involved in creating and training a machine learning model. This includes testing out a number of different algorithms and tuning them (altering and testing various parameters) to get the best results.
I am not going to get into the details of how to use Auto-ML, but here is a good tutorial I followed.
In each case, I only uploaded the data as is, with no extra processing. In some datasets, it is possible to do feature engineering where you would drop, change, combine, or split columns into the data set to get better results. Azure will do some of this, but I think a human touch could still be beneficial in some cases.
Training took several hours for each dataset using a Standard_DS3_v2 compute cluster (4 cores, 14 GB RAM, 28 GB disk). As the training was occurring, I was able to view the process. Azure tested out a large number of models, providing an estimated accuracy for each one. Some models did poorly, while others did well.
Below are some screenshots of what is available after the training was done for the Digit Recognizer data. The first is a list of the models trained and their accuracy.
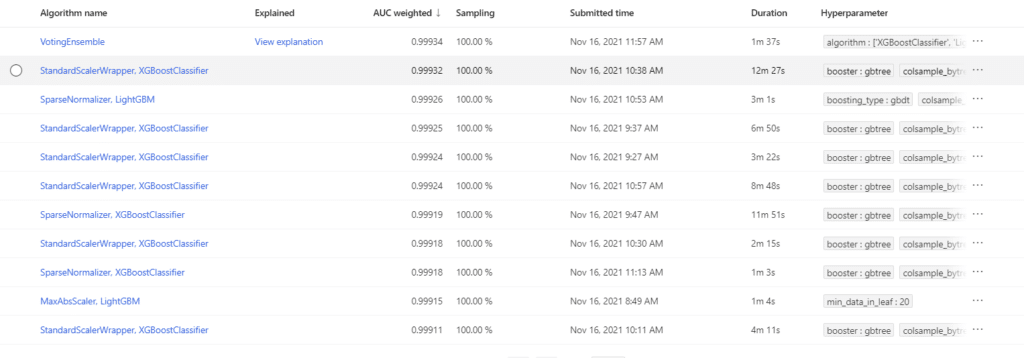
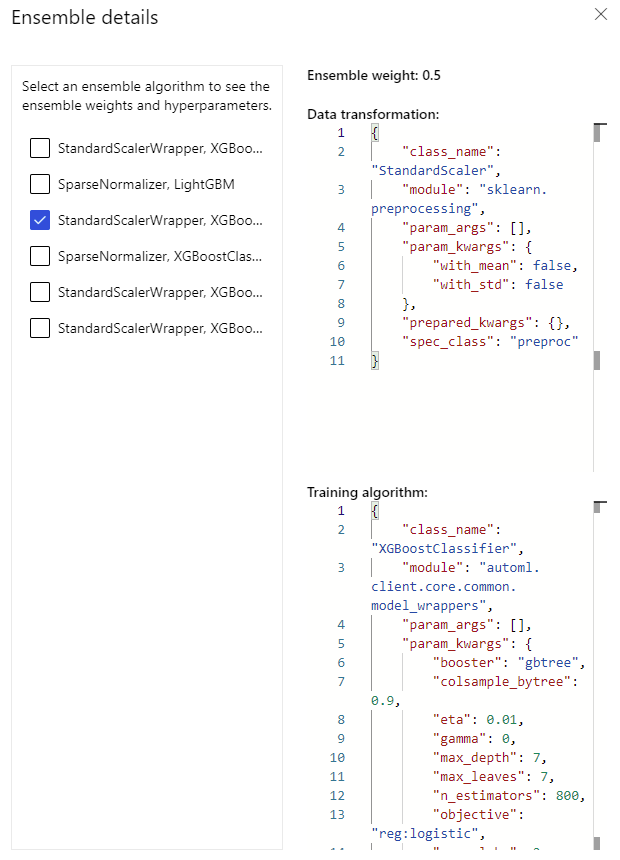
You can see details on those models including the values of the model parameters.
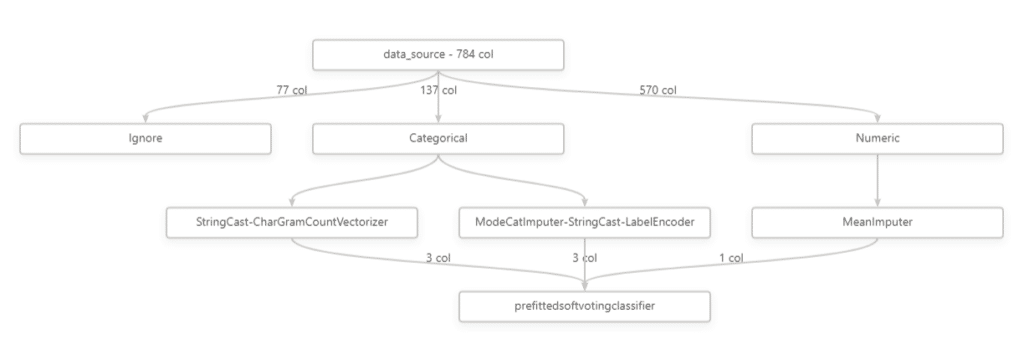
What transformations were done on the data such as how many columns were removed and what was done to those which were used.
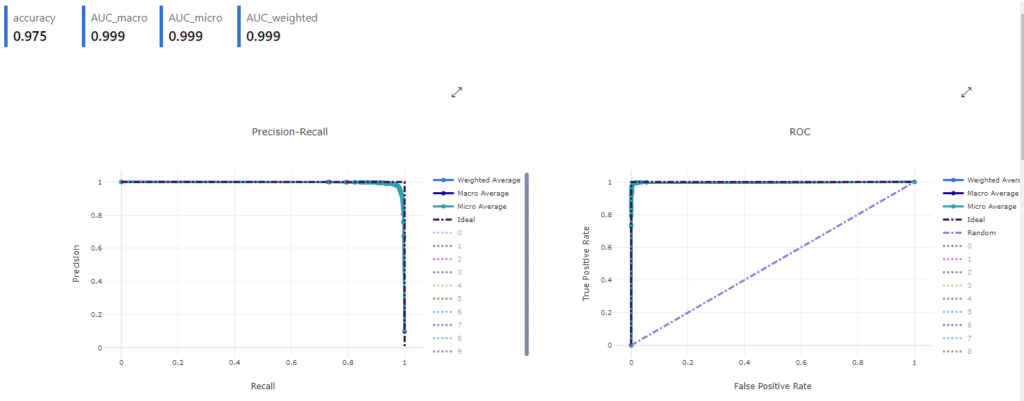
Finally, some metrics on the model’s accuracy. Shown here are the Precision-Recall and ROC curves. These show how well a model is working. Each graph hugging the sides as they do suggests the model is working very well.
Making Predictions
To get the predictions from the test datasets, I first deployed the top model from each dataset to a web service. This allows new data to be sent to the model and predictions returned.
For the Housing data, I did this using Power BI. Briefly, the model becomes a function in Power Query. It sends the data in the query to Azure and returns a value in a new column. In the report, I exported a simple table visual of the House ID and predicted price to submit to Kaggle.
I ran into issues with the Digit Recognizer data using Power BI and had to resort to a Python script which sent the data to the endpoint to get the predictions for that dataset.
Creating endpoints can be the most expensive part of the process from a cost standpoint. Using a compute cluster, either for training or predicting, has an associated cost per hour. Deploying a model to an endpoint adds up as the compute cluster is constantly active. This is something that should be taken into account for production deployment.
Auto-ML Results
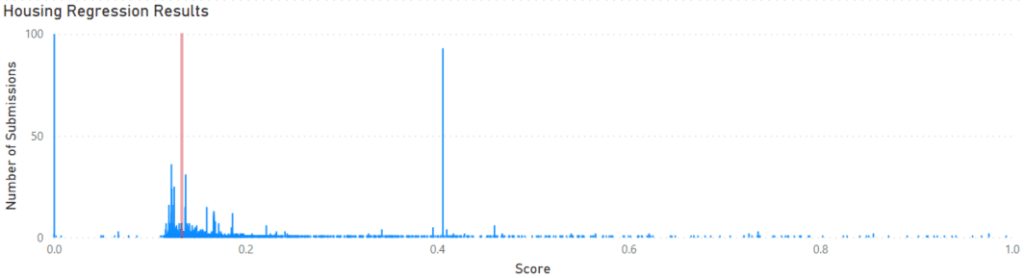
The test results from each model were uploaded to Kaggle for scoring. The Housing results were scored by calculating the root-mean-square deviation between the actual prices and my predictions. A perfect score would be zero. The Auto-ML model scored 0.13356. The histogram below puts this score into context with the rest of the submitted predictions on Kaggle.
As you can see, the Auto-ML model (vertical red line) gets the results in the middle of the main group. So the results are not spectacular but respectable. Especially considering this can be achieved without coding or knowing much about machine learning.
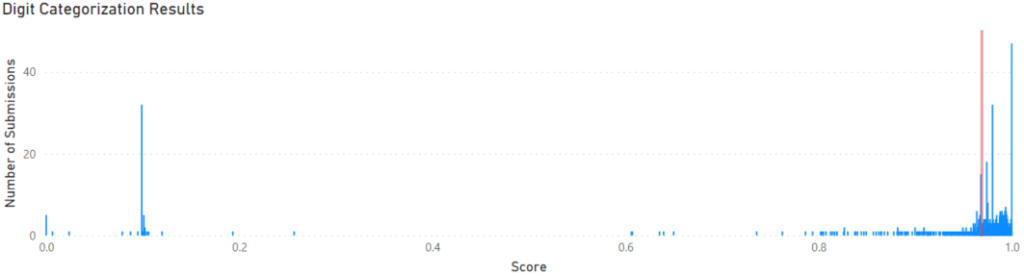
The next model tested was the Digit model. The scoring on this model was based on the accuracy rate of predictions, with a perfect score being one. The Auto-ML model scored 0.96907 and is shown in the context of other submissions to Kaggle below. Again, Auto-ML delivers a result in the main group of the submitted results.
Conclusion
So how good is Auto-ML? Respectable. It is possible to get better results, but this requires significantly more work developing and tuning models, and engineering features. From a practical standpoint, it may not be necessary to get a model which predicts the future with a high degree of accuracy, only a high-enough degree of accuracy. For many applications, I believe Azure’s Auto-ML would be sufficient and allows many users, including those who have little to no understanding of machine learning, to create their models.
