
When it comes to being a business in 2024, your company’s website is a must-have. A website is key for ensuring your customers are able to find information about your product or service as well as a way to contact you.
With this resource, many website owners are interested in understanding the metrics and analytics for their websites. They are looking to answer important questions such as how many users are visiting my website or how our users are finding my website? The industry standard and best tool for this is Google Analytics.
Google Analytics is a very expansive tool with built-in reporting. If you are looking to answer unique questions, create custom calculations, or combine this data with another source, you may want to use a tool like Power BI to visualize and measure your website and Goals performance.
In this blog, we will review how to connect Google Analytics to Power BI so that you can model and visualize your website data. The great news is this is a fairly simple process as Power BI has a third-party Google Analytics connector.
Sections:
- Introduction
- What is Google Analytics?
- What is Power BI?
- Step 1: Get Data
- Step 2: Sign in to Google Analytics and Allow Power BI Access
- Step 3: Load Google Analytics Data into Power BI
- Conclusion
What is Google Analytics?
Google Analytics is a powerful tool that tracks website usage and tracks for free. In order to utilize the tool, you must have an account and add the tracking code to your website. Learn how to do this in this tutorial here.
Some use cases for Google Analytics include measuring website traffic, measuring social media pages, measuring Eventbrite pages, and more.
What is Power BI?
Power BI is the leading business intelligence tool from Microsoft. It is used to connect data sources to model and visualize data into a report-ready format.
The ability to gather data from different sources into one is the main benefit of utilizing Power BI and Google Analytics together.
Step 1 – Click on “Get Data”
If you do not have Power BI downloaded then you can go to https://powerbi.microsoft.com/en-ca/downloads/
or get it through the Microsoft Store on a Windows computer.
Once you have Power BI open, in the ribbon near the top left of the screen you should see a button called Get Data.
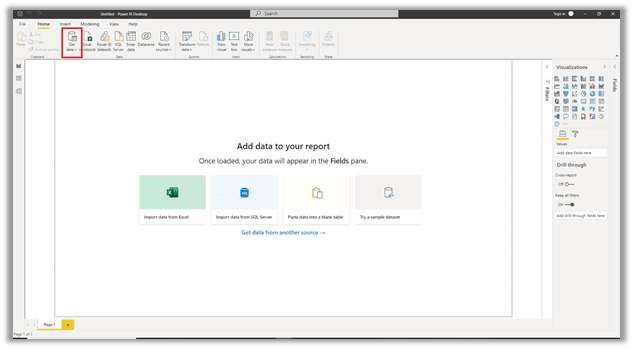
Figure 1- Power BI File

Figure 2 Get Data Button
Click on Get Data and select the More option.
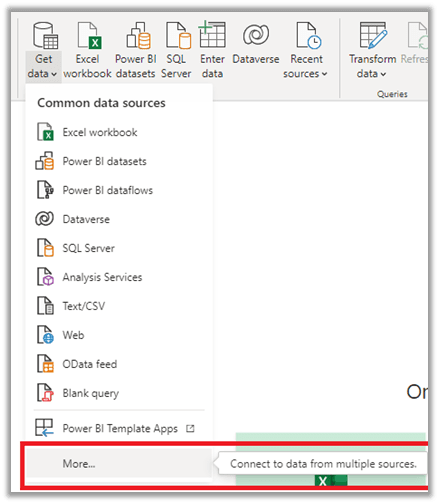
Figure 3 Select More from the Get Data menu
In the Get Data dialogue box, scroll down to find or search for the Google Analytics connector.
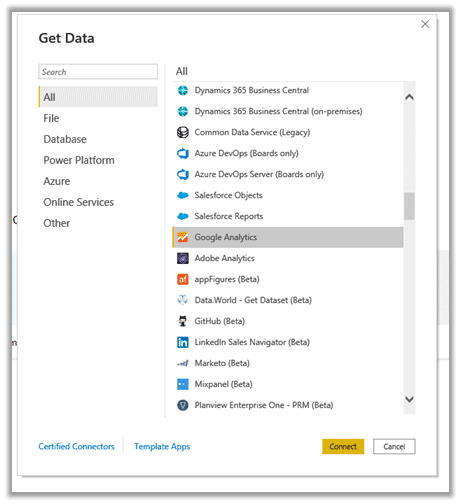
Figure 4 Select the Google Analytics Connector
Power BI will then notify you that the Google Analytics connector relies on a 3rd party service. You can just select Continue to move past this dialogue box.
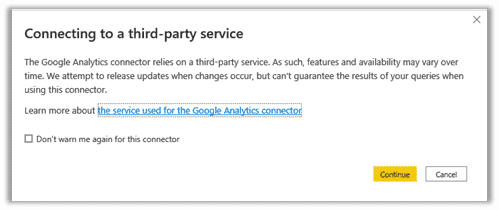
Figure 5 Notification of Third-Party Service
Step 2 – Sign in to Google Analytics and allow Power BI access
Power BI will now prompt you to sign in to your Google Analytics account.

Figure 6 Sign in to your Google Analytics account
Select the account that is attached to the Google Analytics account that has the data you wish to access.
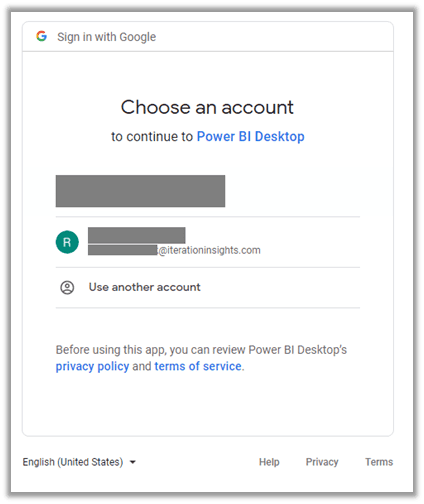
Figure 7 Select your Google account
You then must allow Power BI to access your Google Account.
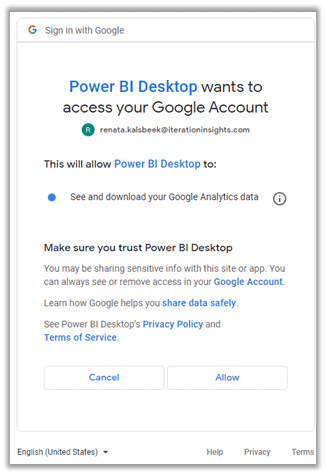
Figure 8 Allow Analytics Access
Once you have allowed access, return to your Power BI file and you will see that you are now signed in. Click Connect to continue.
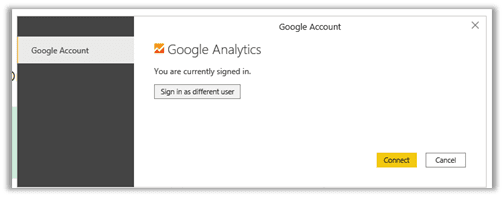
Figure 9 Logged In
Step 3 – Load Google Analytics Data into Power BI
Connecting will open the Navigator box. This is where you will select which data you would like to be loaded into Power BI. The options are set up the same way that the Google Analytics account hierarchy is set up.
The top-level is the Account, the second level is the Property, and the bottom level is the View. Select which account, property, and view that contains the data you are looking for.
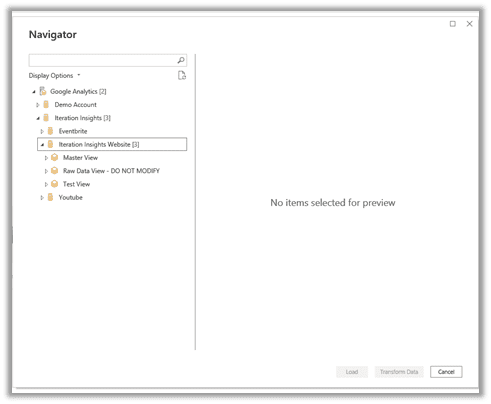
Figure 10 Navigator Box
In order to load in the data, you must ensure that you have the proper permissions in Google Analytics. The last step is to select the tables and load the data.
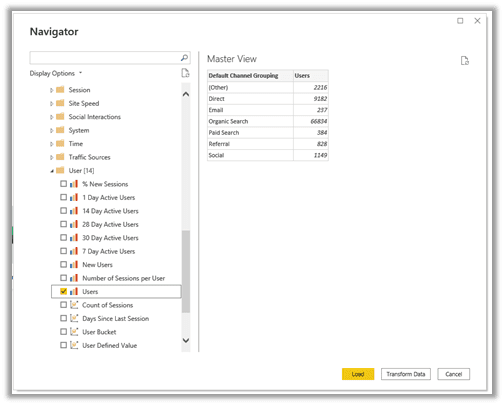
Figure 11 Select Data to Load
Here you have two choices. If you select Load, the data will come into Power BI and the dialogue box will close. If you choose Transform Data, this will load the data into Power BI and open the Power Query Editor so that you may transform and clean the data as necessary.
If you are new to Power BI and are wanting to learn how to transform your data, check out our Introduction to Power BI 2-day training. This is an instructor-led course that will get you on the right track with Power BI.
Where to start with visualizing Google Analytics Data
After connecting the data, the next part is to build a dashboard that will display our insights.
If you are new to Power BI and not sure where to start with building visualizations check out the Power BI AppStore.
Here you will find templated dashboards for you to populate with your data. Note that you may need to pay to use some of these templates.
Conclusion
There you have it! You have now successfully connected your Google Analytics data to Power BI. From here you can now create your calculations and measure to answer your website analytics questions. For analytics consulting, contact us.
Next, you can build a beautiful dashboard with visualizations that present the information you want at your fingertips.
