
You have data for your organization. Financial data. Sensor data. Confidential data. However, you might want some additional data to extend what you have or offer a comparison. Many places are willing to sell data, but the government gives a lot away for free.
Statistics Canada is the main provider of Canadian government data. On their website, you can find information ranging from economic data (employment, GDP, stock market), to demographic data from Census, political data from Election Results, and more.
“If you torture the data long enough, it will confess anything.”
Ronald H. Coase
This information is provided free of charge on either an Open Government License or Statistics Canada License. These licenses are very permissive in what you can do with the data, including re-selling it and creating value added products.
Sections:
Finding Data
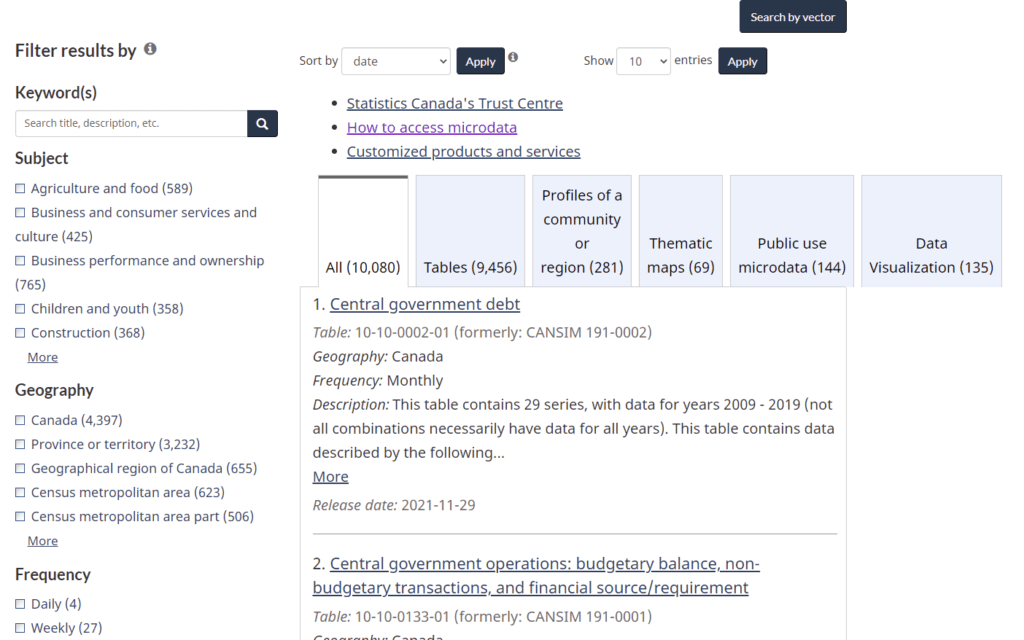
There are several places to find Statistics Canada data. One is on the Statistics Canada website. Scroll down and click on “Access our Data” to go to the search page shown below.
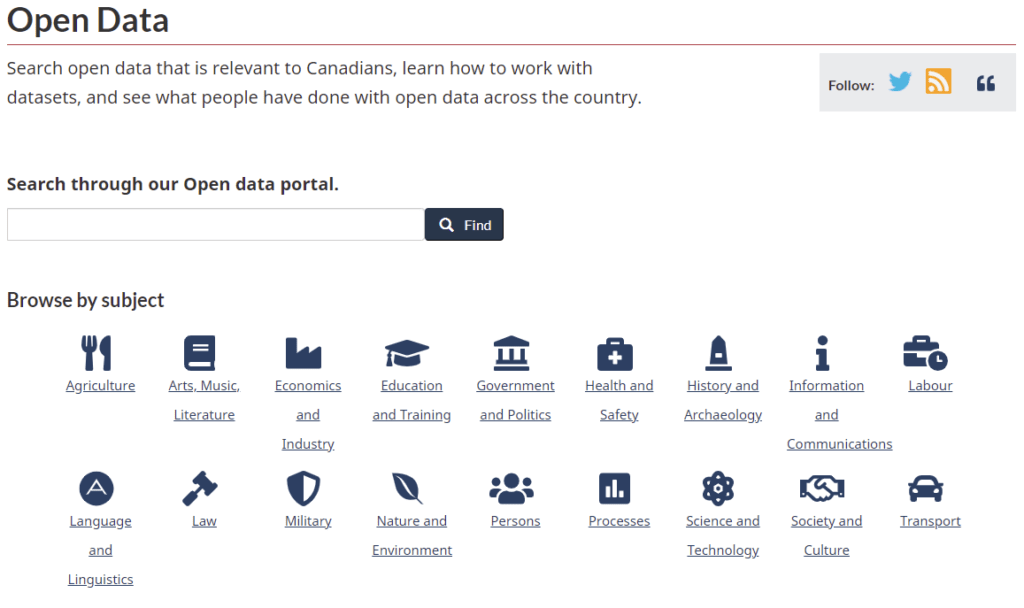
Alternatively, you could go to the Open Government Portal where you can find the below page that provides a little friendlier search experience.
The available datasets are mostly the same between each portal. It doesn’t matter which you decide to use. For this blog, I will be using Statistics Canada. The dataset pages there have some extra options compared to the Open Government Portal that I want to exploit.
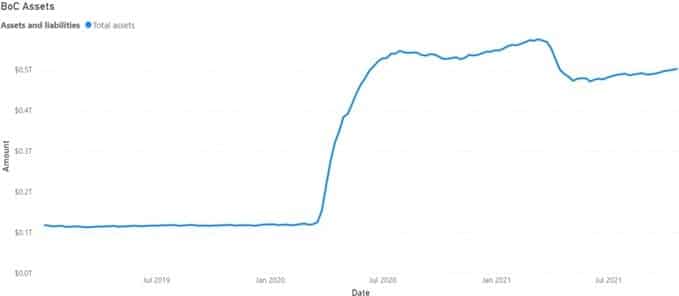
All the datasets on each website have an ID number that identifies the dataset. In this blog, I will be looking at the Bank of Canada (BoC) balance sheet dataset denoted by Table Number 10-10-0136-01. This number can access the dataset page directly by using the URL shown in the image below.
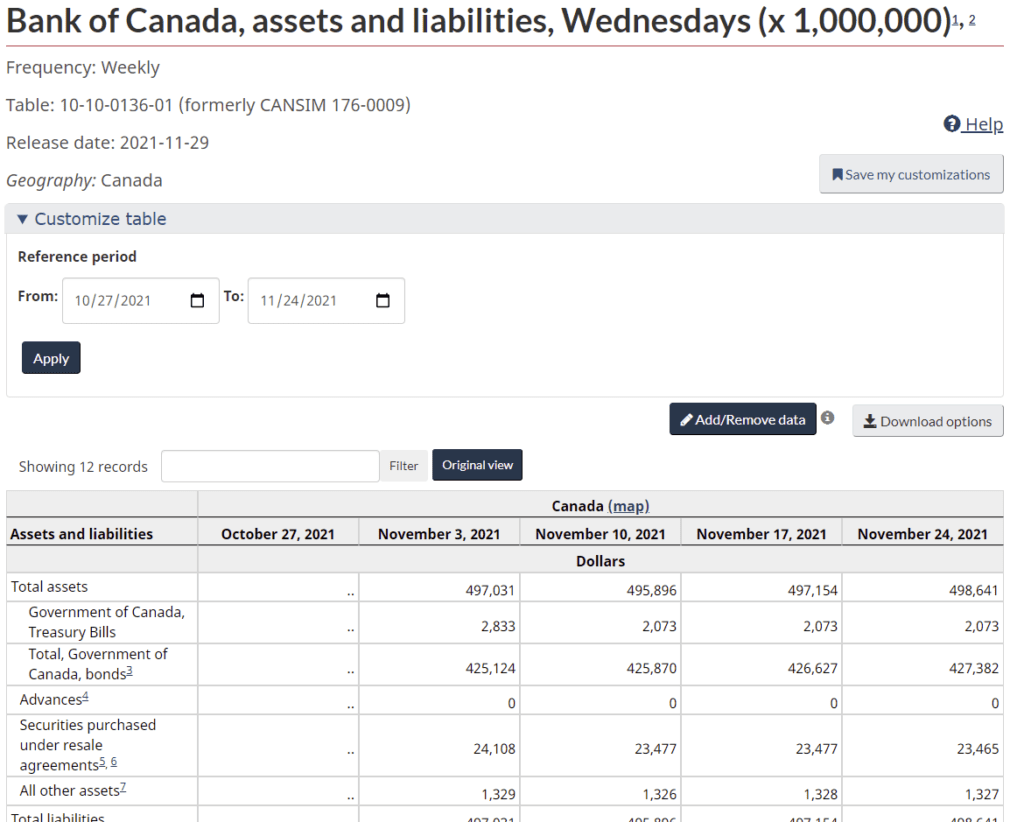
The page contains some information about the dataset, such as how often it is updated. Some datasets are never updated, while others are updated regularly. This one is updated every week.
Some of the data is shown in a table with filters to customize the view. Then, there is a button to download the data.
Downloading the Data
Pressing the “Download options” button brings up a menu of options for downloading the data. The first three options starting with “Download as displayed” downloads the data shown on the preceding page. This data contains complex headers and footers and is really only useful for a one-time pull.
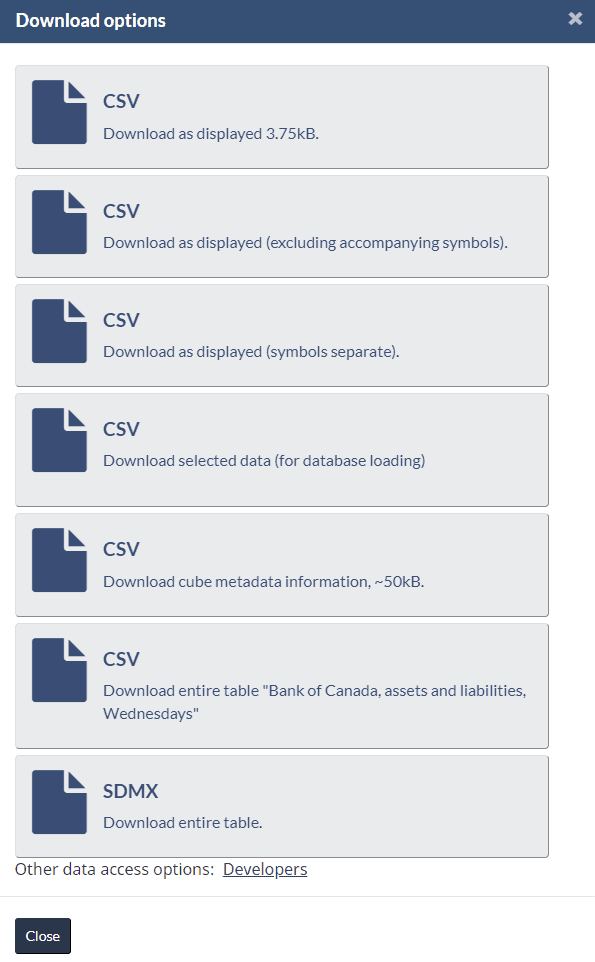
For loading a database the first time, either of the last two options works well. The first, “CSV – Download entire table.” will download a .zip file containing a CSV. The second uses the SDMX format. There is a connector for Power BI that can use this.
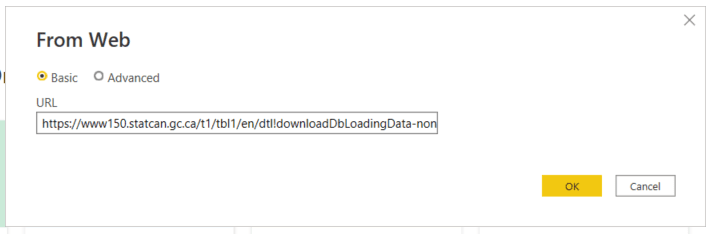
The more interesting option is the “Download selected data (for database loading)” option. This option is the one to choose for doing regular updates of a database or if there is only a certain amount of data you want to view. Right clicking on the button copies the link address shown below.
https://www150.statcan.gc.ca/t1/tbl1/en/dtl!downloadDbLoadingData- nonTraduit.action? pid=1010013601&latestN=5&startDate=&endDate=&csvLocale=en&selectedMembers=%5B%5B1% 5D%2C%5B3%2C4%2C16%2C19%2C23%2C25%2C26%2C27%2C28%2C39%5D%5D&checkedLevels=1D1
And here is the version I used. In the original, the ‘latestN’ value was 5, which brings in the latest 5 updates of the dataset. I removed that value and put in values for ‘startDate’ and endDate to get the values for the last few years. By manipulating these values, you can select the data you want dynamically.
https://www150.statcan.gc.ca/t1/tbl1/en/dtl!downloadDbLoadingData- nonTraduit.action? pid=1010013601&latestN=&startDate=20190101&endDate=20211031&csvLocale=en&selectedM embers=%5B%5B1%5D%2C%5B3%2C4%2C16%2C19%2C23%2C25%2C26%2C27%2C28%2C39%5D%5D&checked
Levels=1D1
This link can be used in a script for regular updates (There are also packages available for Python and R) or used to load data directly into Power BI by using it as a web source.
Using the Data
Most files from Stats Canada contain a common set of columns providing information on the data date, relevant locations, units, format etc. More information on these is available in the User Guide. Some may help with processing the data (see below), but once used most can be removed.
In addition to the common columns, there is also one or more dimension columns for the data presented. The BoC dataset has only one dimension column called ‘Assets and Liabilities’. This column gives the balance sheet dimensions for the BoC. This column can be pulled out to a separate dimension table to create a star schema. (In datasets with multiple dimension columns, creating a separate dimension table would be the recommended way of using the data).
Most of the values in this dataset are in Millions of Dollars. I wanted to convert those to actual values, so in Power Query I created a custom column using the formula below.
This is a generic formula which should work for most datasets. It adds zeros based on the SCALAR_ID column. The SCALAR_ID column gives the number of zeros to add to the values.
Some datasets may contain different types of numeric data in the same table. For instance, some values may be counts (Eg. number of people) and others percents (Eg. percentage of people in a demographic group out of a whole).
For these files, you should create two or more tables, each one holding a certain data type defined and formatted properly. Once in Power BI, you can use the data normally to create visuals.
Combining With Other Data
Sometimes, you may want to combine your data with Statistics Canada data. Combining data requires having some common values to join on (either a join in Power Query, or a relationship in the data model), and there are a couple of ways to do this.
The date is probably one of the most common ways to connect data. Many Statistics Canada data sets have a temporal component, giving values over time. Simply create a relationship between the table and a date table.
Location is another common denominator. Place names can be used but are subject to the names being entered properly in both data sets. Some files contain postal codes, or the first three characters of the postal code, called the Forward Sortation Area (FSA). This is a great option to join to addresses in your own data.
Power BI’s map visual is smart enough to use Postal Codes and FSAs so they will display in the proper location.
The ‘GEO’ column in the data presents the Dissemination Geography Unique Identifier. If you are serious about joining to geospatial data then it may be worth the effort to work this into your own data to provide an easy join.
Some datasets related to businesses contain North American Industry Classification System (NAICS) codes. These data sets could be useful to gain industry-specific information or to see how your business compares to others in your sector.
Conclusion
Governments all around the world have made a huge amount of data freely available for you to use. While I have focused on the Federal Government of Canada, other nations and levels of government have similar open repositories of data. For example, the Government of Alberta has an Open Data site, as well as the City of Calgary.
