
Today we can share practically anything. We share images of the meals we eat, the places we travel to, and our reviews on almost anything and everything. With one swipe and one thumb-click on our phones, we can share with an ever-expanding array of social media and direct messaging platforms. In short order, this has become one of our most used icons:
What about data? How we share our visualizations within our teams depends on a huge number of factors.
- What is the purpose?
- Who is the intended audience?
- Is there a formal process for development?
- How do you want to reach that audience?
- Is there a feedback mechanism for iterative updates?
- Are there enough or complete data sources available?
- Does data governance guide the development process?
- How do you track who has seen or use them?
- How “fresh” does the data need to be? Are updates required?
- How often does the visualization need to be shared?
The answer to these questions guides our data analytics products into four main development directions, visualizations for Enhancement, visualizations for Exploration, visualizations for Intelligence, and visualizations for Engagement. In this blog, we will explore scenarios within each category and how you might use Tableau to share the finished product.
Level 1: Traditional Business Reporting Using Tableau Desktop
As Tableau users, we are asked to help strengthen a narrative, hypothesis, or initiative that a colleague or manager is working on by building a visualization. Beautiful visualizations are what Tableau Desktop was built for, after all.
Once stakeholders within an organization have seen first-hand how impactful a Tableau viz can be, requests will come flooding into the development queue. Typically, these builds are ad-hoc with defined deadlines. The main motivation here is using data visualization for Enhancement.
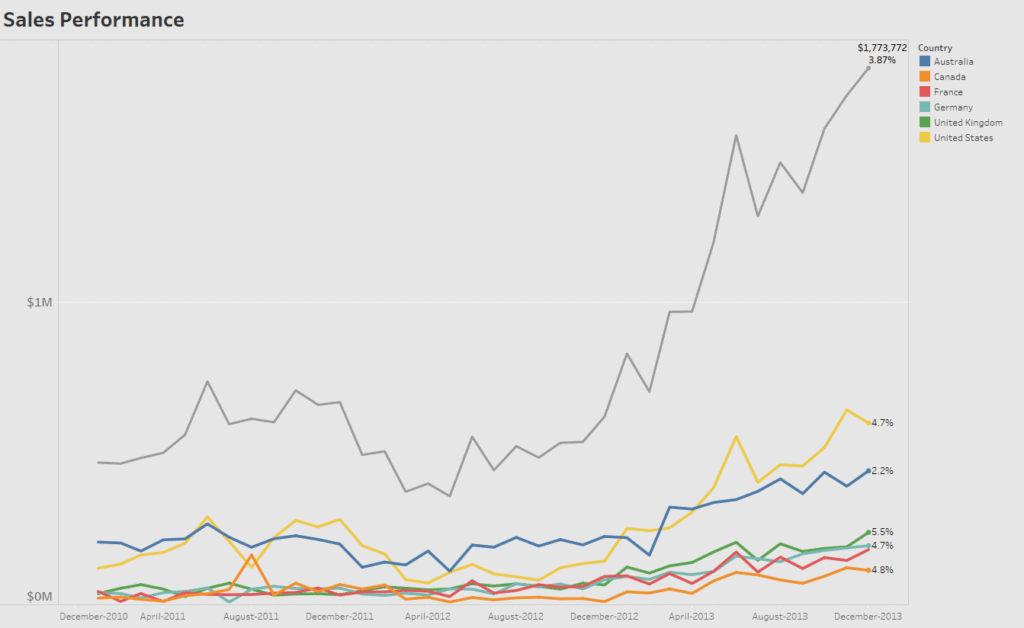
Here is an example scenario. Our company, Adventure Works, sells bicycle and cycling accessories in 6 different countries at branded stores. We have been experiencing overall growth in the past 3 years and the new CFO would like to see our monthly growth trends over this period. Traditionally, the Finance department has been using pivot tables from a build-in SQL data connection within Excel to aggregate the data.
The CFO is making an investor PPT presentation and would like to see a comparison of the sales in each country against the total with the compound growth rate for the most recent month. With a flat file provided by Finance, they would like you to have a visualization ready by the following day.
Complexity is not a necessity here. The audience is limited, the requirements are direct, and the goal is to provide a visualization that would be viewed in one slide and then moved on from. A concise data visualization might look like this:
Benefits Tableau Desktop:
- Data sources and connections are typically already developed
- Targeted data aggregation requirements
- Simplified design needs
- Only requires Tableau Desktop to implement
- Limited stakeholder feedback requests
Challenges of Tableau Desktop:
- Build, use, discard
- Single stakeholder delivery
- Might require supplemental data
- Short time deadlines
- Solution for narrow business need
Level 2: Internal Accessibility by Distributing on Tableau Server
Much of a Tableau Developer’s time is spent researching, designing, engineering, and building products that are more sustainable. Typically, this would be creating dashboards or reports with the user functionality in mind, meaning the person who is interacting with the views are discovering new insights.
The granularity of the data aggregation is designed for the user level with specific insights or KPIs that are driven by managerial targets. The results of which may be used for periodic reporting or regular market update presentations. To achieve such a scenario, a Tableau Data Extract has to be published to a Tableau Server environment.
The data needs to be updated regularly through a refresh extract scheduled on the Server, and dashboards have to be built, published, and distributed to Tableau Viewers. The main motivation at this level is using data visualization for Exploration.
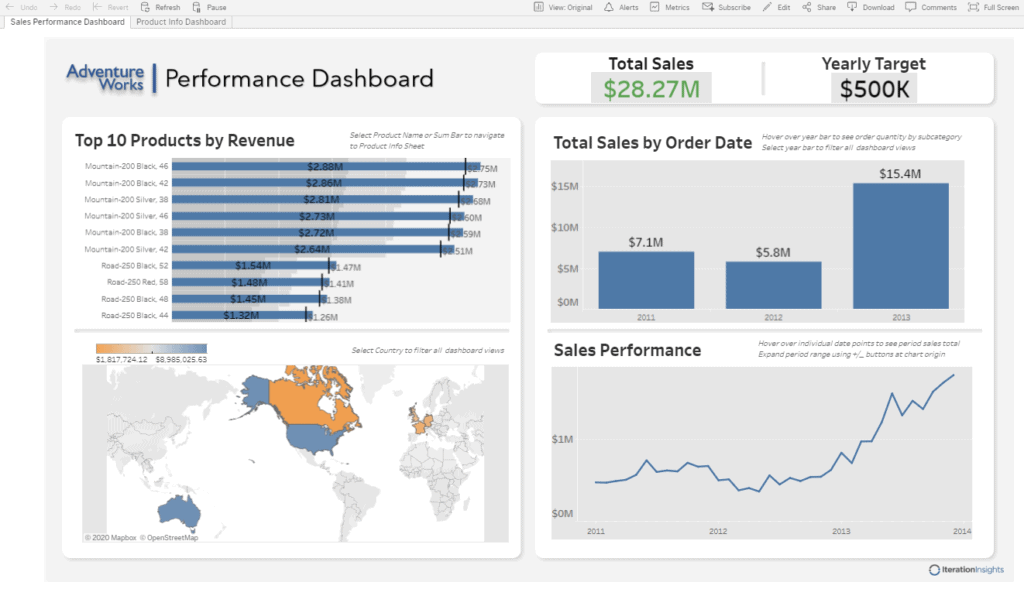
Let’s revisit our bicycle sales company, Adventure Works. We have a team of three revenue analysts tasked with discovering potential demand trends throughout previous years based on seasonality by country and product. Each analyst needs to give a managerial update once every three weeks that includes how their regions are doing over time, which products have the highest revenues, what the total sales are, and how they’re comparing to their product and regional budgetary targets.
Our sales fact has already been linked up to product and category dimensions in a Tableau Extract that has been published to a Tableau Online Server environment. An interactive dashboard with linked visualizations that the analyst team can drill down into to gain new insights into their specific markets might look like this:
Once a dashboard has been published, the Tableau Server environment provides options for interacting with the views beyond just those that have been designed into the dashboard. Data-driven Alerts can be set up to notify users if the data extract refreshes are outside of a target range, scheduled Subscriptions can be timed to send out emails and PDFs.
Additionally, team members can add Comments to views and dashboards that are forwarded to the content owner, and the views can be directly Shared to licensed individuals or groups on the Server or through a copied link.

Benefits of Tableau Server:
- Stakeholders can provide feedback through the Server environment
- Data sources are established
- Managerial KPIs determine the granularity
- Server metrics data monitors user engagement
- Tableau Server environment provides enhanced options for collaboration
Challenges of Tableau Server:
- Limited viewership and scope
- Continuous monitoring and iterative improvement required
- Tableau Server infrastructure and development needed for implementation
- Design creep can detract from the overall effectiveness
- Diverse user engagement requirements for larger teams
Level 3: External Accessibility by Leveraging Tableau Mobile App
Internal business analysts and managers might not be the only organizational stakeholder who needs access to our data analytics products. Not all our consumers will be wanting to, or have the ability to, access our products through desktop workstations. Once published to a Tableau Server environment, dashboards and views can be formatted to fit different device types.
These include both mobile and tablet formats to complement traditional desktop screen resolutions. With Tableau Mobile App, our analytics can provide daily updates in an on-demand, quick-hit medium. The main motivation at this level is using data visualization for Intelligence.
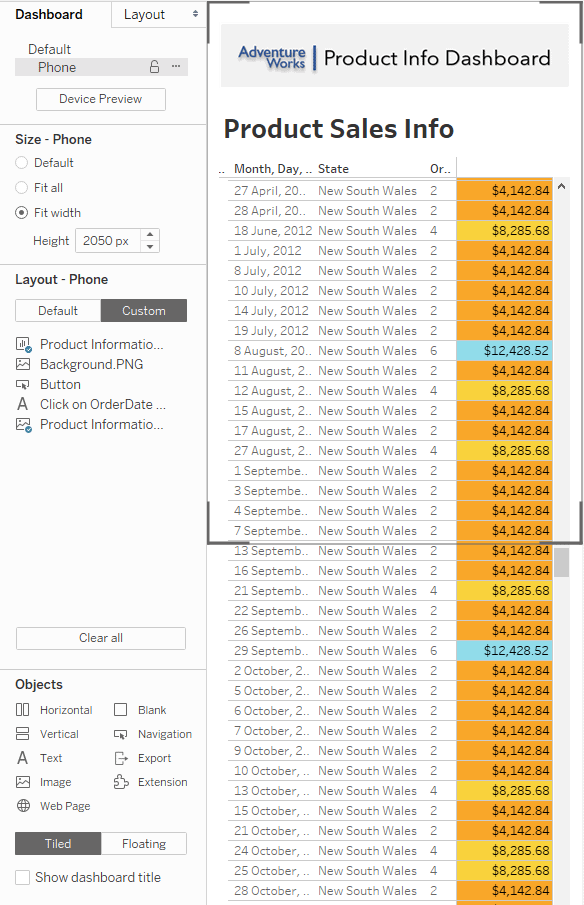
Back with Adventure Works, we have 6 regional managers that spend a significant amount of their time traveling between the stores in their regions, along with suppliers, corporate clients, and sponsors. They need a quick and simple way to look at daily sales totals by product and are primarily on their mobile devices as they travel from place to place. A mobile view that fits these needs might look like this:
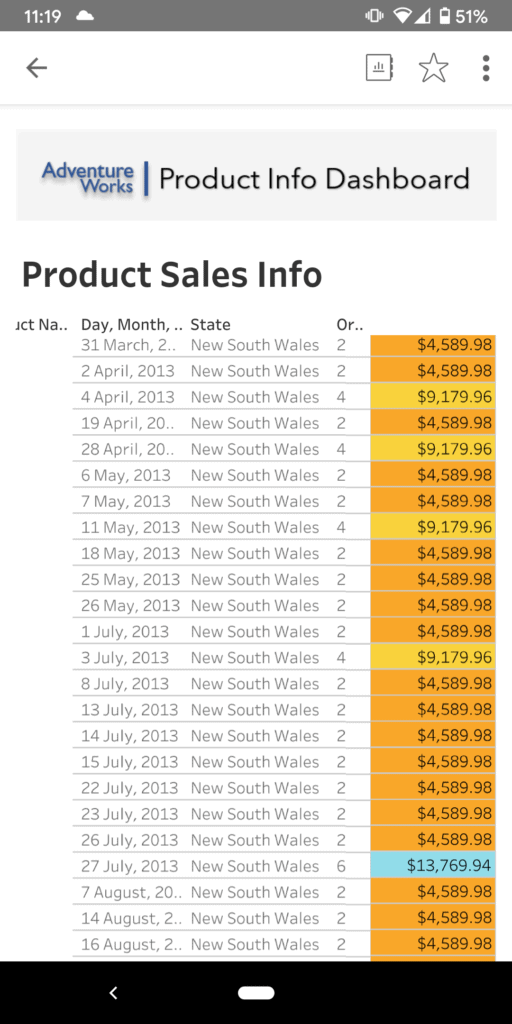
The Tableau Mobile app can be downloaded from the Apple App Store for iOS or from Google Play for Android devices. For more information on Tableau Mobile, click here.
Benefits of Tableau Mobile App:
- Anywhere accessibility
- Simplicity in aggregation
- Minimal revision and updating
- Stakeholders drive KPIs and measures
- Targeted user audience
Challenges of Tableau Mobile App:
- Limited interactivity
- Reduced canvas space for designs
- Awareness of level of detail requirements
- Minimal insight exploration
- Linking actions between visualizations are less effective
Level 4: Broadcast Visual Analytics Through </> Embed Code and Tableau Public
Finally, sharing Tableau Server visualizations is not limited to only organizational stakeholders. We can extend to a further external audience by embedding our interactive views and dashboards into web pages, blogs, wiki pages, web applications, and intranet portals such as Sharepoint.
This ability provides an augmented level of connectivity that our organization can provide to customers, suppliers, and partners. Embedded views do follow the same licensing requirements that exist on the Tableau Server environment, so the user would need to have an account and access permissions to be able to see them. The main motivation at this level is using data visualization for Engagement.
Alternatively, if an organization wanted to connect with a much broader audience, a Tableau Public profile could be created for the purpose of targeted view distribution. This would need to be highly regulated and require a strong corporate data governance model to ensure only non-sensitive or non-propriety information is published.
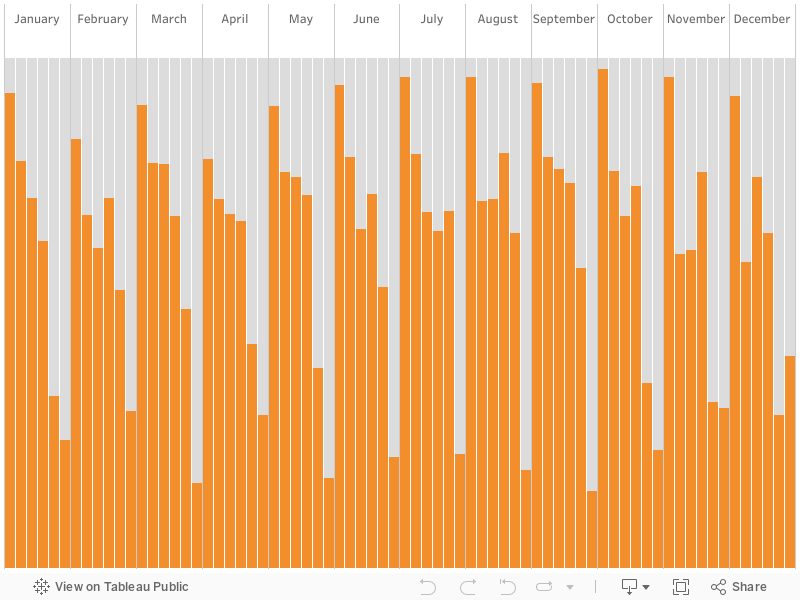
Back to our example. Let’s say the marketing team at Adventure Works wanted to show potential customers how loyal their current customers are by country. Producing a Cohort Analysis chart of sales by customers who have been purchasing cycling products detailed by the year they first ordered and then including it on our corporate website, we can have visitors relate to the buying habits of others from their region. The embedded visualization would look like this:
Benefits of Tableau Embedded Code:
- Direct interactive engagement
- Controlled data messaging
- Minimal revision and updating
- Data-sources internally established
- Deploy directly into applications, web portals, blogs, and Sharepoint
Challenges of Tableau Embedded Code:
- A strong corporate data governance model required
- Feedback is minimal and difficult to obtain
- Requires Design Theory approach for alternate user perspective
- Limited page space for visualizations
- Consideration for embedding parameters
Level-up with Iteration Insights
Tableau facilitates many ways of sharing data visualizations. How we share depends on the level of purpose, audience, accessibility, and feedback we hope to achieve from our data analytics creations.
Connect with us if you would like to know more about Tableau. Iteration is always here to share our expertise in leveling up your data visualization enhancement, exploration, intelligence, or engagement skills.
