
We will not have failure – only success and new learning.
Queen Victoria
Sections
- Introduction
- Creating Graph Tables in SQL Server Database
- Loading Graph Tables
- Querying Graph Tables
- Graph Tables in Power BI
- Conclusion
Introduction
For many data analysts, when they think about databases, they imagine a relational database. These databases have tables that store information in rows and columns.
The tables are then related to each other through relationships based on the contents of certain key columns. These databases are common and work well for certain types of data, such as financial transactions.
There are other types of databases though, one is known as a graph database. Rather than tables, a graph database has edges and nodes. Nodes are entities, like people or accounts.
The nodes are then connected by edges which define the relationship between the nodes. In a graph database, the relationships are data, not just how data is connected.
Graph databases excel in analyzing data where relationships are important, such as family trees. It is possible to store information related to ancestry in a relational database, but to query it, to get the hierarchy of children, parents, grandparents… is difficult.
Graph databases can traverse between edges and nodes and retrieve the data easily.
There are several different graph database systems out there. One of the largest is Neo4j. Since 2017, SQL Server has also included graph tables. In this blog, we will explore SQL Server Graph tables, querying graph tables, and graph tables in Power BI.
Creating Graph Tables in SQL Server Database
SQL Server is not a true graph database. It still stores the information in tables and adds some additional things to the tables to behave like a graph database. As a result, SQL Server may not achieve the performance of Neo4j for example. However, if you are currently using SQL Server, it will still allow for graph processing without requiring you to change technologies.
To demonstrate, I will create a small database populated with information about European royalty using SQL Server.
The following code creates a new database and creates the tables.
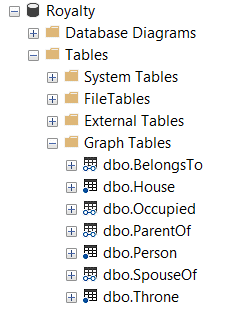
Creating the tables is similar to regular tables, except for specifying whether the table is a NODE or an EDGE. These tables show up in the ‘Graph Tables’ sub-folder in the SSMS Object Explorer where each table also has a special symbol to denote what type of table it is.
I’ll talk about loading the tables below, but first I’ll show you what a populated table looks like. First is the Persons NODE table.
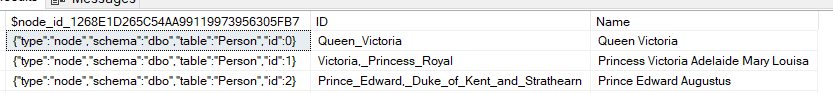
In the definition of this table, I created an ID column, holding part of the Wikipedia page URL for each person, and a Name column. SQL Server added a special $node_id column. This is a system-created column in JSON format providing a unique key for each node.
Here is the Occupied EDGE table which gives information about who occupied which throne and when.

In addition to the two date columns, I created for this table showing the start and end dates of each monarch’s reign. There are three SQL Server system-created columns. The first is the $edge_id which identifies each edge. The $from_id and the $to_id are really $ node_ids for the nodes linked by the edge. ‘From’ and ‘To’ give the relationship a direction.
A good way to think about these tables is that each row is a unique edge or node of a type given by the table they exist in. The table defines the type of node or edge and its properties. Each row is an instance of that node or edge.
Loading Graph Tables
Loading data into NODE tables is very similar to loading data in any other table. Below is the code to load the first few rows of the Persons table.
All you need to load are the columns you defined for the table and SQL Server handles the $node_id column.
When loading the EDGE tables, you need to supply the $from_id and the $to_id values as part of the load. To get these, you will have to use subqueries to collect these values. Below is a script to load the first few rows of the ParentOf table.
INSERT INTO dbo.ParentOf VALUES
    ((SELECT $node_id FROM Person WHERE ID = 'Queen_Victoria'), (SELECT $node_id FROM Person WHERE ID = 'Princess_Alice_of_the_United_Kingdom'), 'Mother')
    ,((SELECT $node_id FROM Person WHERE ID = 'Princess_Victoria_of_Saxe-Coburg-Saalfeld'), (SELECT $node_id FROM Person WHERE ID = 'Queen_Victoria'), 'Mother')
    ,((SELECT $node_id FROM Person WHERE ID = 'Queen_Victoria'), (SELECT $node_id FROM Person WHERE ID = 'Victoria,_Princess_Royal'), 'Mother')
This script queries the Person table to get the relevant $node_id values to put into the $from_id and $to_id columns, forming the edge. It then inserts descriptive information about relationships, in this case, ‘Mother’ or ‘Father’.
Querying Graph Tables
SQL Server adds some additional functionality in querying graph tables. The simplest is MATCH which I will talk about in this blog post. Note that there is more functionality including SHORTEST_PATH which I will not cover here.
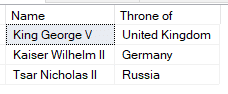
MATCH allows you to filter tables based on the relationships. Below is a query to obtain the reigning monarchs at the start of World War 1.
SELECT Person.[Name], Throne.[Throne of]
FROM dbo.Occupied, dbo.Person, Throne
WHERE
MATCH (Person-(Occupied)->Throne)
    AND Occupied.[Begin Date] <= '1914-07-28' AND Occupied.[End Date] >= '1914-07-28'
The first two lines of this query imply a CROSS JOIN between the Occupied EDGE table and the Person and Throne NODE tables. The WHERE clause filters these for persons who occupied a throne on July 28, 1914.
The MATCH syntax takes the form of (NODE-(related by EDGE)->NODE). This specifies the relationship, including direction, between the tables in this query.
Graph Tables in Power BI
At the moment, Power BI is not the best place for graph analytics. The data model in Power BI is optimized for a relational star schema configuration, not a graph. Still, there are a few visuals that allow for graph analysis.
To bring the data into Power BI requires a bit of work because Power BI won’t import any of the $node_id or $edge_id columns as is. One option is to convert them to a text field or hash them to bring them in. For this example, we will ignore them and use a query that prepares the data to fit into the visuals cleanly.
SELECT
    p.[ID] AS P1_ID
    ,p.[Name] AS Person1
    ,po.[Parent Type] AS [Relationship Type]
    ,c.ID AS [P2_ID]
    ,c.[Name] AS Person2
FROM [dbo].[Person] P,
    dbo.ParentOF po,
    dbo.Person c
WHERE MATCH (p-(po)->c)

UNION

SELECT DISTINCT
    a.[ID] AS P1_ID
    ,a.[Name] AS Person1
    ,'Spouse' AS [Relationship Type]
    ,b.ID AS [P2_ID]
    ,b.[Name] AS Person2
FROM dbo.Person a,
    dbo.SpouseOf so,
    dbo.Person b
WHERE MATCH (a-(so)->b)
This query brings in parental and marriage relationships from the database as one table which we will use to see how the three reigning monarchs during WW1 were connected.
There are a few graph visuals you can use in Power BI. In this post, we will use the Force-Directed Graph custom visual, PBI certified and made by Microsoft. There are a few other graph visuals you can import into Power BI as well as python and R packages you could use as well.
Creating a Force-Directed Graph visual, and using Person1 as the “Source” value, Person2 as the “Target” value, and “Relationship Type” as the “Link Type” produces the visual below.
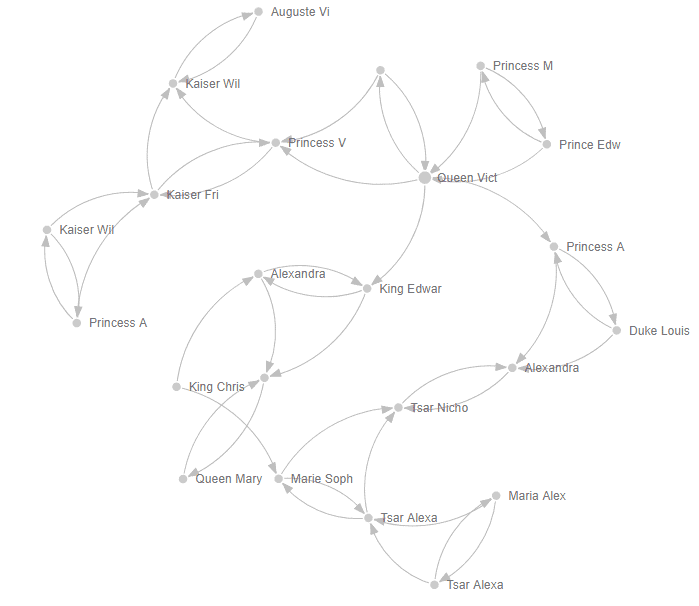
Unfortunately, the visual does cut off some of the labels. I also enabled the relationship arrows, which show the direction of the relationships.
By examining the visual, relationship types show up with the tooltip, we can see that the three reigning monarchs of Britain, Germany, and Russia during World War 1 were all closely connected. King George V of Britain was of course Queen Victoria’s grandson, but so was Kaiser Wilhelm II of Germany.
King George V was also first cousins with Tsar Nicholas II of Russian through their grandfather King Christian IX of Denmark. Additionally, Tsar Nicholas II of Russia was married to one of Queen Victoria’s granddaughters, Alexandra.
Conclusion
In this blog post, we have used SQL Server Graph tables to store information about European royal families. I’ve shown a basic query one can do to select nodes in the database based on their relationships, in this case finding the Reigning monarchs at the start of World War 1. Using Power BI, I used visual analysis to show the family relationships between the aforementioned monarchs.
