Running for its third year, the Movement Challenge is an initiative taken by the Iteration Insights team to promote healthy habits and to push employees out of their comfort zone.
Explore our team’s activities through the dashboard below.
This year’s challenge tapped into the competitive spirit of the team to battle it out for the most hours of movement while at the same time raising money for KidSport Alberta.
KidSport provides grants to help families cover the costs of registration fees so ALL kids can play a season of organized sport in Alberta.
Iteration Insights raised $1000 for KidSport during this challenge. If you would like to join us in supporting Albertan children’s to participate in sport, you can donate or get involved with the organization here.
In this blog, I will be highlighting the process that went into creating a dashboard that would track our teams movement.
Sections
- About the Dashboard
- Targets
- Theming
- Dashboard Navigation
- Data Model Development
- Dashboard Development
- Results
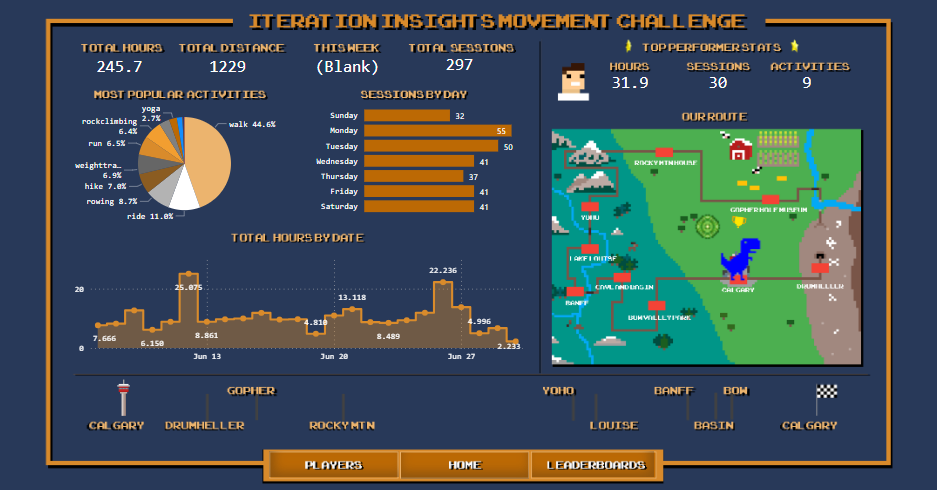
About the Dashboard
Every year, Iteration Insights utilizes Strava to capture our movement data. While this is a great capture tool, we want to be able to analyze and compare the data of each team to see our performance.
For this, we connect Strava to Power BI and visualize the data there. We also match the dashboard design to the theme of the challenge.
This year’s dashboard theme was a galactic journey. Each page in the dashboard transports you into a trip through our solar system, showcasing the different alien ships battling to be on top.
Each team had 7 members from their respective disciplines and were represented by imagined alien species:
O’hu – Business Support Team
Vindrid – Front-end Team
Silan – Back-end Team
Targets
The challenge ran from October 7th to October 23rd.
Our goal was to achieve a total of 60 hours of movement amongst all teams – which meant that each team member had to engage in 30 minutes of physical activity per day.
This challenge also incorporated additional team-based missions through outer space:
- Crew Hours: Each member of the team achieves a total of 6 hours of movement throughout the challenge.
- Crew Activities: Each member of the team achieves a total of 3 different types of activity throughout the challenge.
Incorporating these missions that added to the team’s overall progress motivated each employee to ensure they were meeting their targets and not letting their team down.
Based on total hours and achieving the team missions, this was converted into a dollar value to reach the $1000 donation goal for KidSport Alberta!
Theming
To reflect the sci-fi theme, we implemented the idea of different team ships visiting each planet to collect resources.
Once a team’s certain hours of activity were reached, the team ships would arrive at that planet and gain 500 resources to contribute to the overall team’s total.
Additionally, each team based mission contributed an additional 500 resources once completed. These resources are then translated into a dollar value, which then contributes to the monetary goal.
The addition of the missions added an extra element of competition between teams.
Dashboard Navigation
Clicking the console of the introductory page directs you to the Travel Log.
This page is a comparison of each team’s progress and shows you which team is in the lead. As team members logged their hours of movement, their ships travelled across the planets of our solar system, gaining resources from the planets along the way.
Along the bottom of the dashboard is the navigation pane. Selecting the Ship Log takes you into each team’s ship and illustrates their progress. The planet outside the viewing window will change based on the ship’s location.
Here, you can also see who the commander of the ship is, which reflects the team member that has the most hours of activity logged. Based on the team selected, the colouring of the ship will also change, adding to the overall atmosphere of different alien species spaceships.
The Personnel Log allows employees to view their individual progress and confirm if they have accomplished their portion of the team based mission.
Lastly, the Rankings page showcases which individual employee had the total number of hours across all teams. Here you, can also see the Most Improved employee, representing the employee that had the greatest increase in hours from the first half to the second half of the challenge.
Most Variety is also reflected here, which shows the employee with the greatest number of different types of activity logged.
Data Model Development
Similar to previous years of the Movement Challenge, employees logged their movement sessions utilizing the Strava app. Data from the app was collected utilizing a Google Chrome extension that exported the movement logs into a CSV file.
Power BI was then connected to the CSV file that was stored in the company’s Sharepoint directory through a web-based connection.
With the data now available, the following bus matrix was developed to guide the creation of appropriate dimension tables.
This outlines the relationships between the needed metrics (aggregations) and dimensions (attributes).
| Metric/Dim | DimDate | DimActivities | DimEmployees | DimTeam | |
| Fact Activities | Hours Sessions Activities | x | x | x | x |
The DimEmployee and DimTeam tables were manually built out based on employee information, while DimDate and DimActivities were built using DAX functions.
As the Strava app has a large variety of activities to choose from, pipelines were established to populate the activity table as data flowed in, rather than undergoing a manual mapping process for the purposes of the project. Then, utilizing Power Query, the data imported from the raw CSV file was cleansed to reflect appropriate data types, and maintain only the columns needed for calculating the metrics.
The remaining table had the following columns:
- Activity Type
- Employee Name
- Date
- Duration
Dashboard Development
To ensure the dashboard maintained the theme of the challenge, Canva was used to develop the backgrounds and then imported them into Power BI. Canva was also used to change the appearance of the employee’s pictures to reflect their alien race.
Due to the dynamic nature of the challenge, and wanting to showcase the travel across the solar system, DAX measures were made to switch between the images of the spaceships on the canvas based on reaching the targeted values. The changes in image and colours on the Ship Log were also implemented the same way based on the selected team and location.
DAX measures also had to be developed to determine team mission success. The CALCULATE function was used to filter employees down according to their team, and then using SELECTEDVALUE, a true statement was returned when all members achieved their part of the mission.
Results
As a group, we were successfully able to raise $777 for charity! Even though we were only able to reach about 75% of our goal through our movement, we will still contributed $1000 to KidSport!
Here is a breakdown of our teams achievements:
Team Silan
Total Hours: 51.52
Leader: John Llamzon
Team O’hu
Total Hours: 51.68
Leader: Joelle Mason
Team Vindrid
Total Hours: 55.94
Leader: Tutu Hamid
Thank you for following Iteration Insights’ 2023 Movement Challenge! We are all looking forward to what next year’s has in store for us.
View Previous Year’s Dashboards