
Human-readable file formats are a common way to store data. Their advantages lay in the ability for both humans and machines to easily read them. Additionally, the simple text formats allow them to be platform and software agnostic with little fear of depreciation over time.
The most common format is the Comma Separated Value or CSV file type. CSV’s do an adequate job at storing a table in an intuitive style similar to a spreadsheet.
Two other common types are the JSON and XML file types. Both of these file types are a little more complex than a CSV but are more flexible. Although they are different file types, they behave similarly in storing and loading data.
Even if you do not know anything about these file types, you have likely used them before without knowing. For example, there is a JSON file containing the definition of your report within a .pbix file. This file defines the number of pages, which visuals, where they are on the page, and what data they use.
Web pages use a form of XML called HTML. Try right-clicking on this webpage and select View page source. This button will bring up the HTML code used to create this blog post’s web page.
In this post, I will run through a few basics of JSON and XML file types. I will then demonstrate how they load into Power BI.
File Type Basics
JSON
Below is a portion of the JSON file used in this blog post; you can find the whole JSON file at the end of this page. The file stores some information about a few bird species.
![File snippet:
[
{
"Common Name": "Great Horned Owl",
"Order": "strigiformes",
"Family": "strigidae",
"Calls": [
{"Call": "whoo! Whoo-whoo-Whoo! Whoo! Whoo!"},
{"Call": "hoot-hoot-hoot-hoot"}
],
"Colours": {"Upperparts": "dark brown/grey brown",
"Underparts": "dark barred",
"Breast": "white"}
},](https://iterationinsights.com/wp-content/uploads/2021/04/JSON.png)
JSON stores data as key-value pairs (“key”:value). Groups of key-value pairs inside curly brackets are called objects, each pair separated by a comma. The sample shows one bird object which you can think of as one row of data.
In this file, one outer set of square brackets contains the bird object. This set is called an array and uses a comma to separate each one.
These features can also be nested. For the bird’s calls, I have added these in a subarray of Call objects, allowing me to add a variable number of calls for each bird.
For the bird’s colours, I have added them as an object containing keys to different parts of the bird and its colour. Birds have various areas listed, but only out of a limited set.
XML
XML uses tags to mark the data. A tag starts and ends with “<” and “>” characters. Tags form the beginning and end of sections. Tags with “/” are ending tags, ending a section begun by a tag containing the equivalent text.
Data is stored either as elements, appearing between a set of tags, or attributes, within the tags. Below is an example showing the same data as the above JSON snippet.
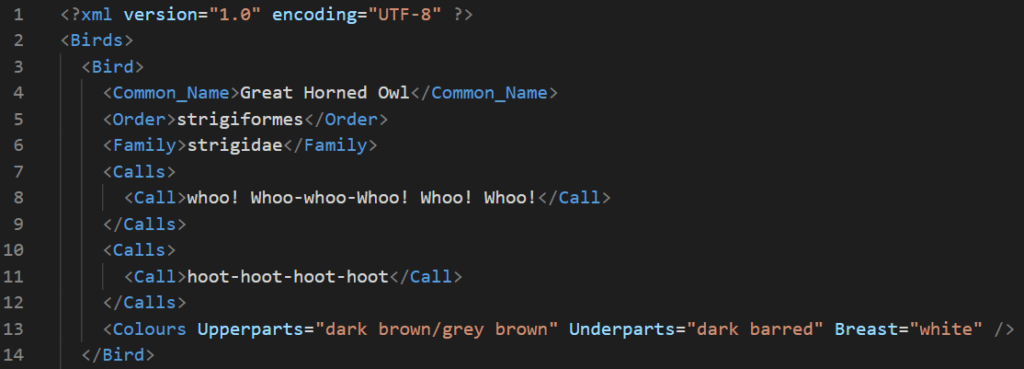
Most of the stored data is called elements. I have several repeating “Calls” tags allowing for a variable number of calls to be included. Colours stores the data as attributes within the Colours tag.
JSON and XML in Power BI
To load data from a JSON or XML file, select the file type when prompted as part of the Get Data. The location is near the top of the list, right after CSV files.
Note, when using or making these types of files, be sure to stick to a consistent structure as the behaviour of these files in Power BI is dependent on their structure. My goal here is to show some features, but files you encounter may work differently based on their structure.
After finding your file, you will have the option to transform the data before loading; this is best practice. Depending on the file, you can choose to expand the table or columns of the table. Expand them until the table in Power Query looks like the one below.
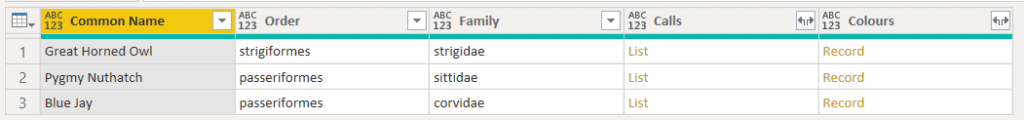
You can see the three species of birds listed in the files, along with their Order and Family. Still to be expanded are the Calls and the Colours. These will operate similarly in each type of file.
First, the Colours. The file only mentions five different areas. Different birds refer to various parts, with some overlap. Expanding the colours produces the following.
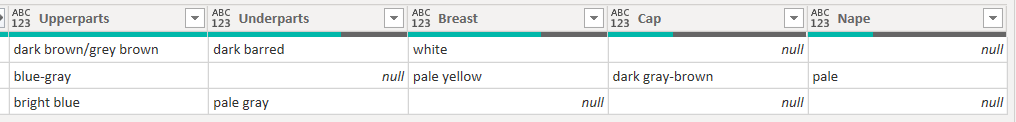
Power BI scans the file and picks out the different parts of the birds, and then creates a column for each one. It inserts null values where there is no data.
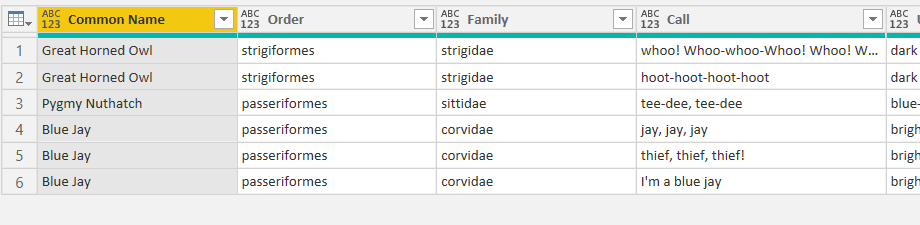
Expanding the calls happens a bit differently. The data entry style allows for a variable number of calls to be entered per bird, but they are all still calls and appear in the Calls column. Here a bird can have anywhere from one to an almost limitless number of calls.
Power BI handles this by adding rows instead of columns. Expanding the Calls (the JSON query took two steps) duplicates each of the existing rows for each Call. If a bird has only one Call, then it stays with one row. However, if it has more than one Call, each row for that bird is duplicated for each Call.
Depending on your needs, simply expanding the table like this may work. An alternative method would be to duplicate or reference this query to a new one that only keeps the Common Name and the Call. This query would leave a table with one row per bird and another with 1 to n rows per bird of calls.
Conclusion
That’s the basics of loading JSON or XML data into Power BI. JSON and XML files are common ways to store data in a format that is both human-readable, but structured so that software can ingest them. Each of these file types provides more flexibility than a CSV in how the data is stored and as a result how Power BI will handle the data.
Birds.json
Birds.xml
<?xml version="1.0" encoding="UTF-8" ?>
<Birds>
    <Bird>
        <Common_Name>Great Horned Owl</Common_Name>
        <Order>strigiformes</Order>
        <Family>strigidae</Family>
        <Calls>
            <Call>whoo! Whoo-whoo-Whoo! Whoo! Whoo!</Call>
        </Calls>
        <Calls>
            <Call>hoot-hoot-hoot-hoot</Call>
        </Calls>
        <Colours Upperparts="dark brown/grey brown" Underparts="dark barred" Breast="white" />
    </Bird>
    <Bird>
        <Common_Name>Pygmy Nuthatch</Common_Name>
        <Order>passeriformes</Order>
        <Family>sittidae</Family>
        <Calls>
            <Call>tee-dee, tee-dee</Call>
        </Calls>
        <Colours Upperparts="blue-gray" Breast="pale yellow" Cap="dark gray-brown" Nape="pale" />
    </Bird>
    <Bird>
        <Order>passeriformes</Order>
        <Family>corvidae</Family>
        <Calls>
            <Call>jay, jay, jay</Call>
        </Calls>
        <Calls>
            <Call>thief, thief, thief!</Call>
        </Calls>
        <Calls>
            <Call>I'm a blue jay</Call>
        </Calls>
        <Colours Upperparts="bright blue" Underparts="pale gray" />
        <Common_Name>Blue Jay</Common_Name>
    </Bird>
</Birds>
