
Creating a Power BI Dashboard for Calgary Public Library’s Ultimate Summer Reading Challenge
Sections
- Introduction
- A Family Passion
- Creating the Dashboard
- Book Analytics & Insights
- Conclusion
- Acknowledgements
Introduction
The Calgary Public Library has offered a summer reading program for many of its 110 years of history in the city. Today, Ultimate Summer Challenge is the library’s annual program helping tens of thousands of kids to develop a lifelong love of reading.
As a child, my summers involved picking up an 18 by 18 sheet of paper from the Southwood Library and filling in the bubbles every 30 minutes I read. Many of us remember this process fondly as we read through our first Amelia Bedelia stories, Magic Treehouse novels, and The Amazing Days of Abbey Hayes.
Twenty years later, I was honored by Iteration Insights and Calgary Public Library with the opportunity to analyze the data collected from this year’s Ultimate Summer Challenge and showcase it through a business intelligence dashboard.
A dream-come-true, some would say for me. Throughout building this dashboard, my co-workers and bosses called this my passion project as they noticed my passion and enthusiasm oozed whenever I spoke about it.
A Family Passion
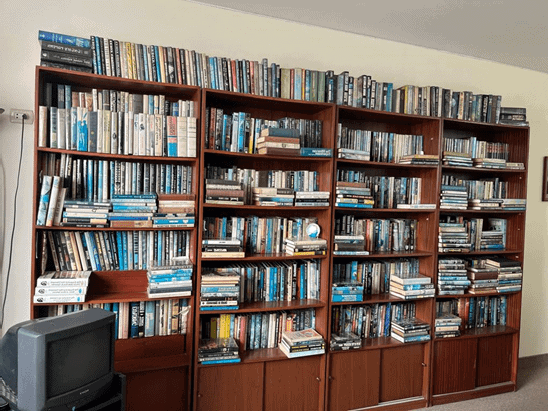
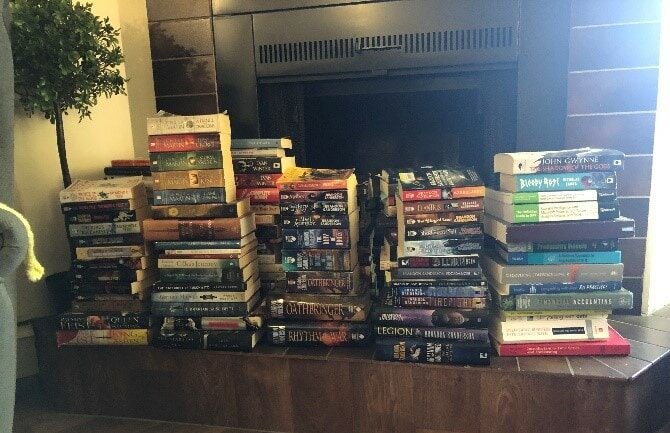
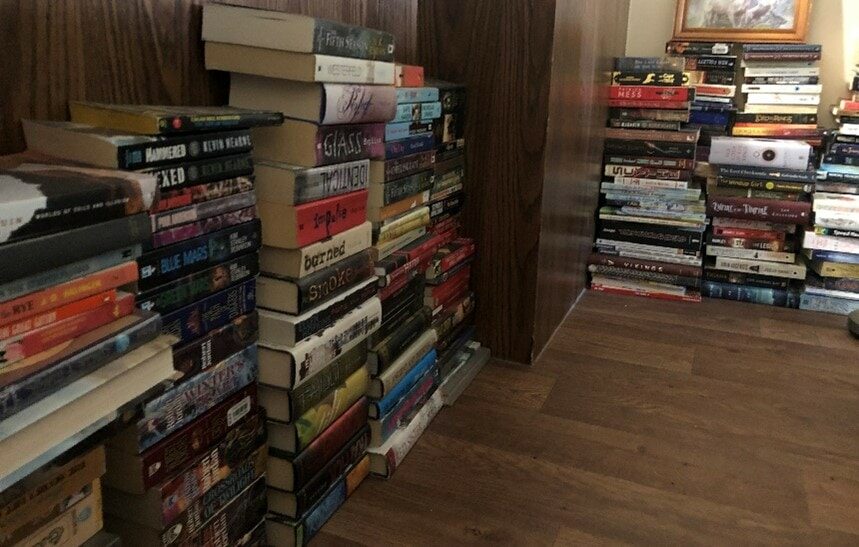
Similarly, to my fellow book lovers, reading books is nurtured into us by watching others read. Books have always surrounded our homes, filled bookshelves, surfaces, and staircases.
My mom never told me to read, put a timer on, or gave me rewards for reading. My love of reading came from watching her entranced in a book… or in hundreds of books.
With her Ph.D. in English Literature, she inspires everyone around her to read and escape through stories and prose. She has successfully reached the max number of holds (50) you can put on books at the library and the maximum number of books you can check out (99) multiple times.
She has read more books than I have ever seen anyone read. Except! For my Abuelito.
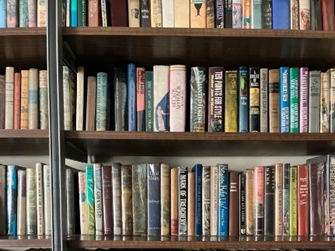
My Abuelito’s library is still in Lima, Peru. It fills over 17 bookcases surrounding the walls of my grandmother’s apartment. Thousands of books, first editions, hardcovers, and each individually plastic-wrapped for protection from the elements.
My mom told me once that the books he owned were the ones he had read more than once. On top of the books he owned, he had piles of checkouts from the library each week. He would read in lineups at the movie theatre and even in traffic.
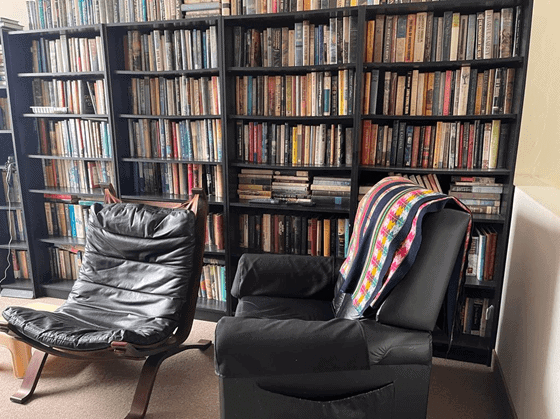
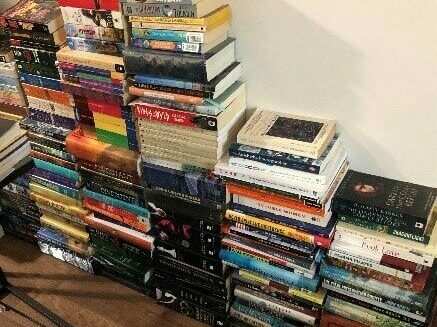
To say this love has not fallen to me is an understatement. My apartment floors and walls are piled high with my small library of books.
My dad infused another passion in me: the love of numbers, science, and figuring out how and why things work. As a mechanical engineer, he is endlessly fascinated with all things automotive and the science and history of the world.
Combining these passions has inspired me to become a data analyst who tells stories through data.
Iteration Insights was looking for opportunities to give back to the Calgary community. They noticed my enthusiasm and offered to gift a Power BI dashboard of the Ultimate Summer Challenge to Calgary Public Library, with me as the lead dashboard developer.
With this incredible opportunity, I immersed myself in data related to books to create a dashboard that told a compelling data story about this year’s reading challenge.
Creating the Dashboard
Business Requirements
I met with members from various departments of the Calgary Public Library and asked them what key insights they would like to see from the challenge.
After consolidating the requirements, I prioritized the items I knew we had data on. Then, I began using Kimball’s Bus Matrix method to plan my data model and identify the necessary tables.
Data Source & Model
Using the application or web browser for Beanstack, I looked into the users registered, logged minutes and days, set reading timers, entered book titles, completed activities, and badges for draw entries.
The data was collected by Beanstack and displayed in the form of reports (Excel spreadsheets) to administrators. I imported these reports from Beanstack into Power BI Desktop and developed a data model for the dashboard.
Using Power BI Query Editor and DAX Calculated columns, I cleaned and transformed this data into the required tables. With these tables, I created a Star Schema Data model that would allow me to filter visualization tools in the dashboard by a specific age group, date, and library branch.
Design
Once I completed the model, I began planning the data story I wanted to tell. I wanted to tell a compelling narrative to empower the team to see their data clearly and quickly, leading to higher productivity. It also allows them to make better and faster business decisions.
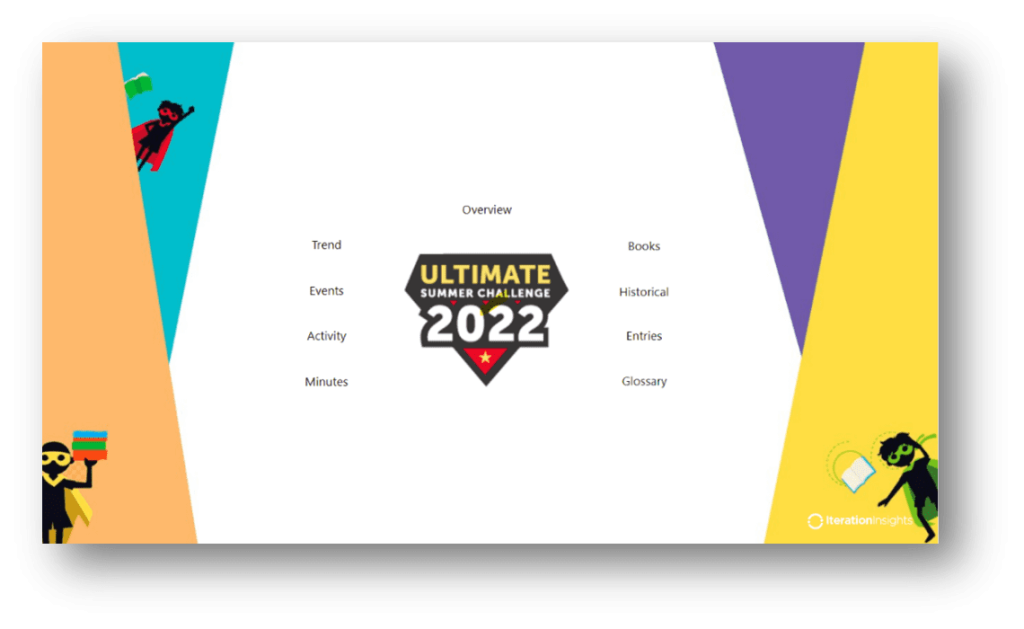
With no surprise, I design my dashboards like a book. Books usually have an overview of what you are about to read on the back cover or inside flap. They have a cover page, a table of contents, and sometimes an index or glossary.
Books are generally formatted this way to provide a cohesive and clear flow for the reader. This format is familiar, accessible, and consistent. And I use these same design considerations when telling stories with data.
The Summer Reading Challenge Dashboard has a Title Page containing interactive navigation to any page in the dashboard (Table of Contents).
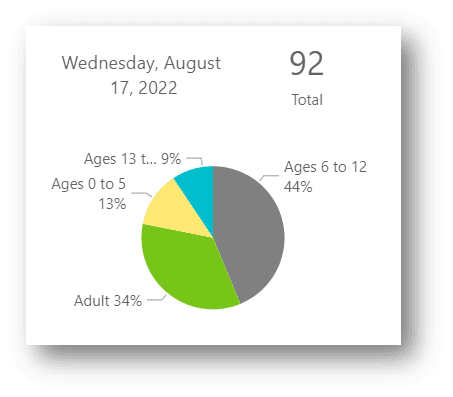
The first page is an Overview, displaying effective visualizations of the most important statistics at a full picture level (the Back Cover).
As you venture further into the pages, you enter deeper into the visual story. The pages display statistics and visual representations of more specific areas of the challenge, including Logged Minutes, School Events, and Activities (Chapters in a book).
Each page contains different filters to be able to analyze the data further. Users can analyze data by a specific age group, library, or date by selecting the drop-down menus.
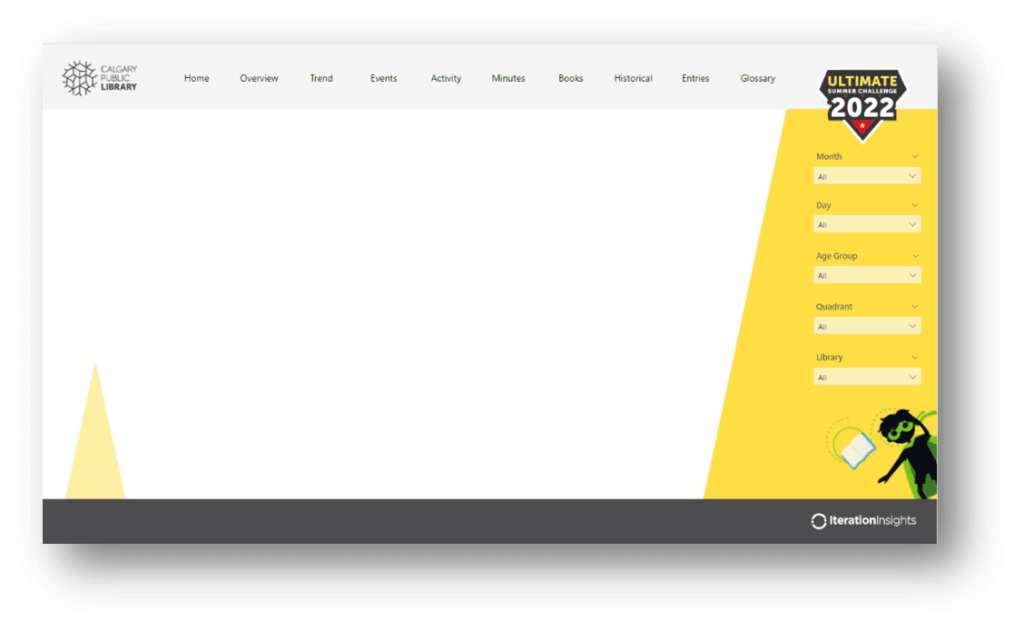
Users can also hover over data points in graphical representations to bring out pop-outs for quick views of the data point from different angles of analysis.
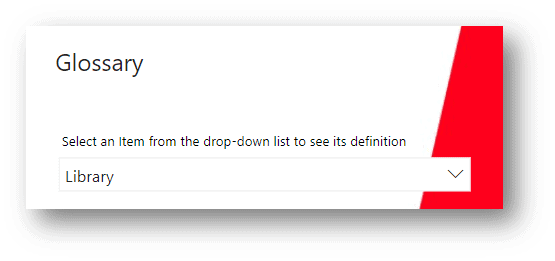
The last page includes the methodology of the data, describing any concepts and assumptions used. It also has an interactive glossary for users to look up definitions of terms seen throughout the dashboard.
Book Analytics & Insights
The dashboard gives the team valuable insights into how successful the Reading Challenge was at gaining participants and the activity throughout the challenge. It included data on the impact of school events on registrations, which activities users did the most, which age group is reading the most, the logged books, and how COVID-19 impacted registrations.
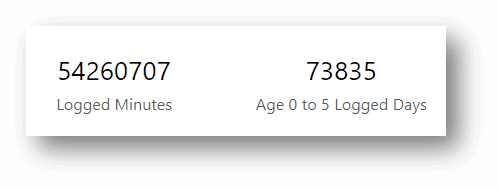
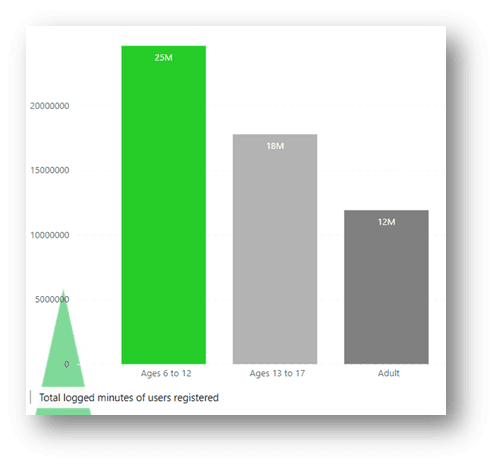
My analysis of users’ logged minutes displayed that Calgary and its surrounding areas logged over 54 million minutes in this year’s challenge! The age group 6 to 12 led the challenge with 25 million minutes logged!
I was able to pull data from previous years’ programs for historical analysis. Comparing the summer reading programs before COVID-19 to today, we see a significant increase in the number of logged minutes and participants in the challenge this year.
Surprisingly, books logged this past summer were a variety of classics and familiar titles logged multiple times. Harry Potter books appeared in three age groups above five years of age, Captain Underpants 12 times, Anne of Green Gables 11, and Dracula 4.
I was surprised to see books appear that I had been reading in the challenge growing up, namely Divergent, Artemis Fowl, Eragon, and Life of Pi. Diary of a Wimpy Kid and Dog Man surpassed all with over 50 logs each.
Conclusion
I hope there are readers out there who are as excited about data around books as I am. I know the Calgary Public Library has a special shelf in other people’s hearts like mine.
Being able to tell compelling stories with data through a dashboard about books was a dream come true. I hope this inspires users to participate in next year’s Summer Reading Challenge to support the Calgary Public Library. (The challenge includes adults now!)
And I also hope that this inspires my fellow data analysts to tell powerful stories using data from their passions and dream big in data storytelling.
Acknowledgments
Thank you first to Tutu Hamid, my dedicated mentor. Thank you to Iteration insights for providing me with the opportunity to work on my passion project. Thank you to Lina Al Dana and Ian Schuyt, who advocated for me and for this project, and kindly took the time out of their days to work with me to make this dashboard possible. Thank you to Calgary Public Library for honouring me with this opportunity, and for fulfilling a dream of mine. Thank you to my mom and dad for inspiring me every day with their passions.
And thank you, Abuelito, for starting it all.
