
Sections:
- How Cloud Tools Changed the Game
- Why Change From the Old Enterprise Data Architecture?
- Everybody Into the Data Lake
- What Is a Modern Data Architecture?
- The Analytic Data Model Is for the Business
- The Kimball Dimensional Modeling Technique
- Star Schemas Are the Analytic Data Model
- Business Needs Change
How Cloud Based Tools Changed the Game
A few years ago, how we built data warehouses had remained the same for years.
The approach was the same despite the tools improving, then came the big data explosion. To meet the demanding performance and scaling requirements needed to use this data, many companies turned to cloud-based services.
Over the last few years, these services have become full-fledged data platforms, with powerful tools available at a low cost. The largest change we see in our new projects is the move to cloud-based analytic tools.
While each project is different, they make this choice based on some common reasons:
- The price for performance of the cloud versus on-premise.
- The selection of tools that are available and ready to be used.
- The speed and scalability of the tools utilized.
With a new toolset, our approach must change. Each tool has its benefits and costs. In the cloud, you pay for every service that you use. Storage is cheap, and processing is expensive.
But we can design new systems to minimize the use of processing so that the total cost is much less than a comparable on-premises solution.
Why Change From the Old Enterprise Data Architecture?
The old on-premises approach to enterprise data architecture worked well for years. But the trend is to move away from large schema-based databases to using file-based data lakes.
The driver of this change is simply cost.
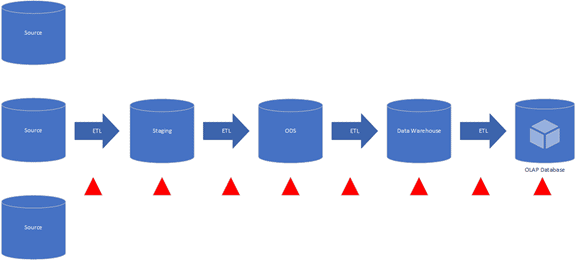
A change in a source table meant a stream of changes needed at every point.
Multiple ETL packages needed to be changed and tested. Multiple database tables needed to be changed and tested.
Any reports based on the analytical model would need to be changed and tested.
Added to the cost of change is the cost of these large databases. A company needed to provide a database server large enough to meet the peak demand for processing.
The company paid for this capacity even when they only used it a few hours a day.
Everybody Into the Data Lake
To use a cliché the data lake is the game-changer. Data lakes handled the demands of the big data surge.
They handle vast amounts of data of a variety of types, quickly, at a low cost.
A data lake separates the cost of data storage from the cost of processing that data. And this gives us a lot of options on how, when, and where we model the data for use.
The idea is to take the data warehouse into the data lake.
We take it out of a database server and put it into the data lake as a set of files. These files are:
- Fast
- Flexible
- Cheap
- Compressible
- Splittable
- And Scalable
In a data lake, raw data flows from the source system to the destination in its native format, making use of flat files for storage. After collection, you model the data with other cloud-based tools.
Transforming raw data into structured data for analytical consumption.
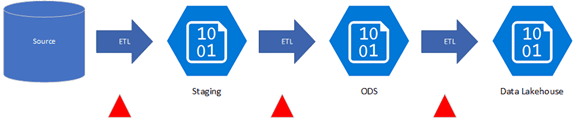
This makes it far cheaper and faster to change. You still have some work to do to change the ETL steps, but you just overwrite the files. Staging contains your source extract, which matches the source schema but is converted to a file.
The ODS file also contains the source schema but represents a historical delta load for that source. The final ETL step does most of the analytic data modeling as it loads into the data lakehouse.
What Is a Modern Data Architecture?
In the cloud, we have a lot more tools to choose from. There are more options on how to provide a cost-effective solution. In the cloud, small things are scalable and changeable.
So, we want to use a lot of small things. We want to push the load upstream where it is cheap, in the data lake. We also want to avoid processing charges.
The following is an example of a modern data architecture using the Microsoft Azure suite of services.
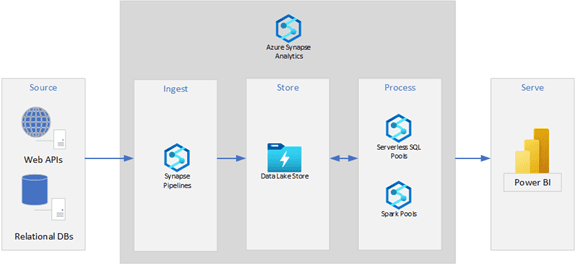
This is a simple, scalable, and powerful structure for a lot of analytical workloads. However, while companies consider the total cost, they don’t care about the tools we use.
They care about whether the analytical solution will meet their business needs.
The Analytic Data Model Is for the Business
A few years ago, when businesspeople wanted to analyze their data, they went to their IT department, and IT would eventually ramp up a data warehouse project.
They often focused these more on the needs of the IT department than on the needs of the business.
Today, the trend is that business is driving the analytics project. They are directly contracting out their analytic needs with IT acting in a supporting role.
During development, it is critical to engage with the business. If you are going to create business solutions, you need to understand the business.
Your job is to understand the business and know what they are talking about and what they care about.
The data itself is only part of the picture. It is there to inform the company’s business decisions. It provides the foundation for their understanding.
We give shape and meaning to the data to make it useful to the business. We want to expose the underlying patterns and trends of the business.
The business user needs a distilled and simplified view of their data so they can be self-serving. You can increase user acceptance by making the model as simple as possible. This typically means fewer tables.
We want to simplify the data model so that the business user is independent of IT.
The data model describes what sort of data the tables will hold and how to organize it.
Since 1996, the best way to design a business-friendly data model has been the dimensional modeling technique introduced by Ralph Kimball. As business becomes more directly involved in analytical solutions, the use of dimensional modeling continues to grow.
The Kimball Dimensional Modeling Technique
The Kimball approach is to keep thinking of the questions that the business needs to be answered. And to think of these needs in the terms and definitions that the business uses.
You learn about these needs by talking with the business. You talk about one business process at a time. Discover the questions they have that data can help answer.
When you are talking with them, you pay attention to the words they are using, the nouns they used to describe it, and when they use the word ‘by’.
Let’s say the businessperson mentions that “I look at the sales trend by region”. Here the nouns are sales and trend and the ‘by’ word is region.
So, we can determine that they want to measure sales over time and filter or group the sales by the region they occur in.
This is the beginning of a dimensional data model. Things that we measure go into tables we call facts. Things that we filter or group by going into tables we call dimensions.
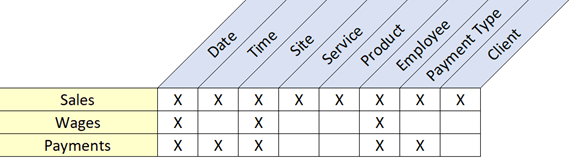
Once you have gathered several of these business needs, create an enterprise bus matrix to discuss with the business. This is a visual representation of business measures associated with the dimensions that interpret them as what the business cares about.
Have we discovered what the business needs to answer their questions?
Star Schemas Are the Analytic Data Model
Based on this high-level understanding, design the data model for the solution. Think about the level of detail the fact tables will contain. Which measures belong to which table.
Determine how the measures will aggregate based on the associated dimensions. The fields needed to aggregate the measures and the dimensional table they belong in.
Data normalization is not an issue in a dimensional model. Dimensions are relatively small tables – they can have repeated field values.
Then you bring the fact and dimensional tables together, joining them with keys. This data model is then called a star schema.
Star schemas are easy to understand and use by the business. They provide one version of the truth.
They make use of a smaller number of tables. Fewer tables in a star schema make it easier for business users to find their data.
We make a star schema to distill the data so that the business can understand it.
The star schema is a mechanism for simplification and distillation. Fact tables are numbers, dates, and keys. Dimension tables are the attributes used to aggregate the numbers.
Conformed dimensions are tables that are shared across multiple fact tables. Slowly changing dimensions allow for the changes that a business goes through.
Business Needs Change
Businesses change faster today than they did in the past.
The traditional enterprise data architecture cannot keep up with the current pace of change, and it is simply too expensive to change. The modern data architecture changes fast and at a low cost.
This new architecture means we must change how we data model. We need to change the data model frequently and cheaply. Using files stored in a data lake allows us to keep pace.
For the business to use the analytical data model, it must be simple, understandable, and useable. The best way to design it is to use the Kimball dimensional modeling technique and build a star schema.
