
Sections
- What is Multiple Linear Regression?
- Let’s Do Some Predictions!
- Step 1: Create R Script in Power Query Editor
- Step 2: Create What If Parameters
- Step 3: Create a Measure for the Regression Formula
- Bonus Challenge!
- Conclusion
- Resources
- More Stats Blogs!
View the tutorial in the Power BI Dashboard or keep scrolling for text!
Updated July 2022 with instructions on creating visual in “Results” page!
What is Multiple Linear Regression?
Multiple Linear regression is a statistical model that predicts an event based on several explanatory variables. Each variable represents a factor that influences the event and is assigned a weighted value.
Multiple linear regression is an extension of simple linear regression. Simple Linear regression predicts the outcome of an event based on a dependent variable. Calculating each weighted value is done using historical data.
If you would like to learn more about Simple Linear Regression, check out this blog dashboard for a tutorial on How to implement Simple Linear Regression in Power BI.
Use Cases for Multiple Linear Regression:
Estimate blood pressure. We can use multiple linear regression to predict blood pressure for a person based on factors like height, weight, age, and hours of exercise per week.
Forecast crop growth. Agriculturists can use multiple linear regression to create the equation of a line formula using factors such as rainfall, temperature, and amount of fertilizer to predict the effect on crop growth.
Sports Scoring. Sports analysts can use multiple linear regression to predict scoring points for players based on how many hours of yoga, weightlifting, cardio, or low-intensity exercises they do.
Let’s Do Some Predictions!
Download the pbix file to follow along here.
Multiple Linear Regression uses the equation:
Y = b0 + b1x1 + b2x2 + … + bpxp
Where:
Y = The predicted value (Price)
b0 = Y – intercept
b1 … bp = Slope coefficients for each explanatory variable
x1… xp = Explanatory variables (Bedrooms, Bathrooms, square footage)
We are going to predict the estimated price of a house based on the number of bedrooms, bathrooms, and square footage selected.
To do this, we calculate the values of the slope coefficients (b1 …bp) and the Y – intercept(b0) using R script within Power Query Editor. Then, we are going to create what if parameters as our explanatory variables (x1… xp). And finally, we will complete the formula as a measure and visualize our predictions.
Steps We Need to Take:
1. Create R script in Power Query Editor
2. Create What if Parameters
3. Create measure of Multiple regression Formula
Data Prep
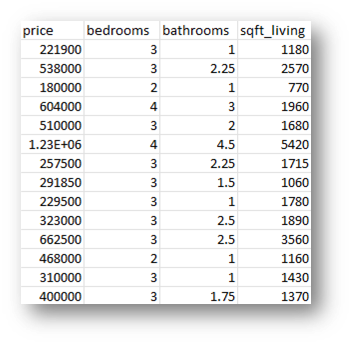
For this tutorial I have chosen a simple dataset based on housing prices in King Country USA from Kaggle.com.
Disclaimer: This dataset was chosen solely for a simplified demonstration of multiple Linear Regression. To implement successful multiple linear regression, your dataset MUST follow the 4 assumptions of regression. To Learn more about how to test for the 4 assumptions, click here.
For multiple regression analysis, it’s best to remove all columns from the dataset that are not included in our formula. These columns can cause an impact on our results. Our formula is Price = bedrooms(x) + bathrooms(y) + square-feet(z), therefore I have removed all columns that are not Price, bedrooms, bathrooms, or square feet. You can do this in excel before importing your data or in Power Query Editor in the Power BI Desktop.
To Download a version of this dataset that is prepped for Step 1 of the tutorial, click here.
Step 1: Create R Script in Power Query Editor
Load your dataset into Power BI. On the Home ribbon, click Transform Data.
In Power Query Editor, with your table selected in the queries pane, go to the Transform ribbon and Click Run R Script.
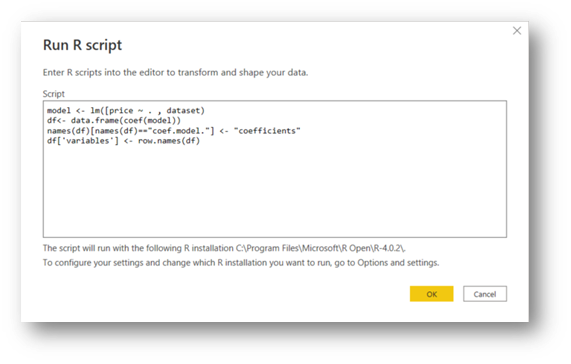
Replace the default text that appears in the R script box, with the script below:
model <- lm(price ~ . , dataset)
df<- data.frame(coef(model))
names(df)[names(df)=="coef.model."] <- "coefficients"
df['variables'] <- row.names(df)
For more information on Using R in Power BI, check out this blog post by Stephen Zielke.
Press Ok, and your result should be a table that looks like the one below:
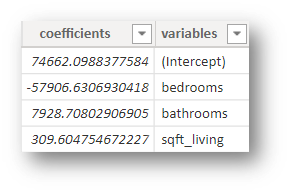
The Coefficients from the table fit our multiple linear regression equation!
Y = b0 + b1x1 + b2x2 + … + bpxp
Y(Price) = 74662.1 – 57906.6(bedrooms) + 7928.7(bathrooms) +309.6(Sqft_living)
To return to the Power BI Desktop, click Close and Apply
Step 2: Create What If Parameters
Now that we have our coefficients(b0,b1…bp), we will create What if parameters for our variables(x1…xp).
A What-if parameter allows you to create an interactive slicer with a variable to visualize and quantify another value in your report.
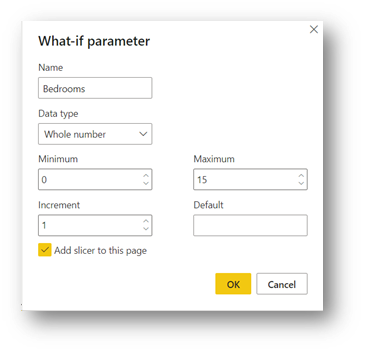
In the Modeling ribbon click New Parameter
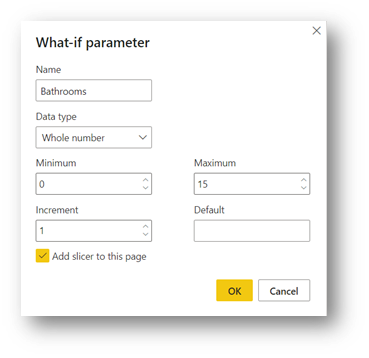
Name: Bathrooms
Data type: Whole Number
Minimum: 0
Maximum: 15
Increment: 1
Add slicer to this page: yes
Name: Bedrooms
Data type: Whole Number
Minimum: 0
Maximum: 15
Increment: 1
Add slicer to this page: yes
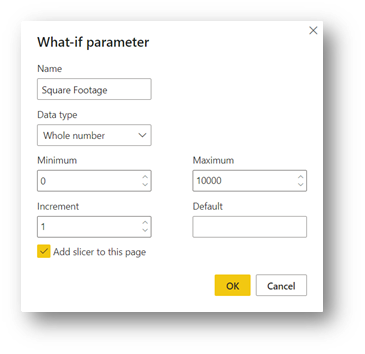
Name: Square footage
Data type: Whole Number
Minimum: 0
Maximum: 15
Increment: 1
Add slicer to this page: yes
These what if parameters will have generated a series of possible values for bedrooms, bathrooms and square footage that we can select based on our preference.
Step 3: Create a Measure for the Regression Formula
With our Multiple Regression formula from Step 1:
Y(Price) = 74662.1 – 57906.6(bedrooms) + 7928.7(bathrooms) +309.6(Sqft_living)
We can now create a DAX measure of this formula using our what if parameters as the variables.
Create the DAX measure below:
Price =
74662.1 - 57906.6 * ( 'Bedrooms'[Bedrooms Value] ) + 7928.7 * ( 'Bathrooms'[Bathrooms Value] ) + 309.6 * ( 'Sqft_Living'[Sqft_Living Value] )
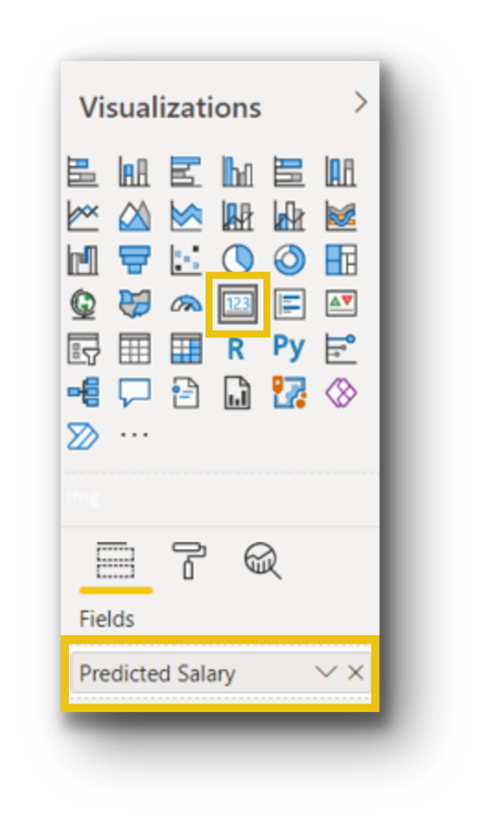
Insert a card visual in the report and select the measure you have just created for the field.
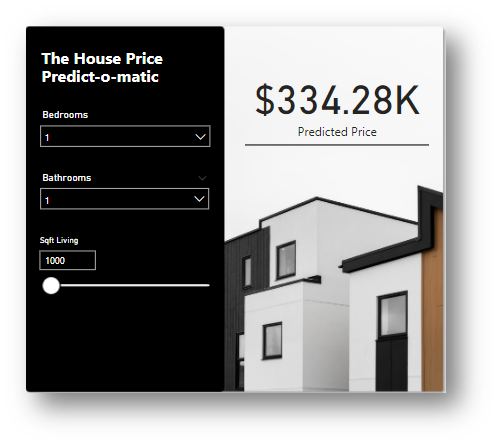
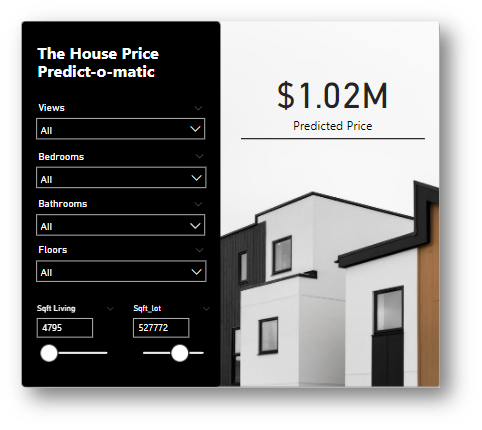
Check out the Power BI Dashboard at the top of the blog to try out the House Price Predict-o-matic!
Bonus Challenge!
Try adding these variables to the Multiple Linear Regression Equation!
Number of floors
Number of views
Square footage of the lot
To Download a version of this dataset that is prepped for the Bonus challenge, click here.
Hint! Here is the new DAX formula:
Price =
76114.2 + 5237.4 * ( Bathrooms[Bathrooms Value] ) - 49819.3 * ( Bedrooms[Bedrooms Value] ) + 9491.5 * ( Floors[Floors Value] ) + 285.6 * ( Sqft_Living[Sqft_Living Value] ) - 0.81 * ( Sqft_lot[Sqft_lot Value] ) + 98795.2 * ( Views[Views Value] )
Conclusion
In this blog, we harnessed the power of the R engine within Power BI to create a multiple regression formula and predict the price of a house. Multiple linear regression is used for forecasting future events based on historical data and is extremely useful for preparation and decision making. I hope you enjoyed this tutorial on how to use Multiple Regression in Power BI. Try it yourself and let me know your results!
Resources
Multiple Linear Regression Equation
Four assumptions of multiple regression that researchers should always test
What is Multiple Linear Regression
4 Examples of Using Regression in Real Life
Multiple Linear Regression in Power BI
More Stats Blogs!
How to do Linear Regression in Power BI
